

But despite that, average house prices held up across England – even if there was a drop in sales.
It was the same picture in Leeds, where prices rose by 7.1 per cent in the year to September 2020.
The ONS also publishes house price figures by Middle Layer Super Output Areas (MSOAs) – small geographic areas containing an average of 7,200 people.
These figures show that 24 of the 107 MSOAs that make up Leeds actually saw a fall in house prices over the same period.
Here we reveal which neighbourhoods saw their prices fall in the year to September 2020:
Images are for illustrative purposes only.
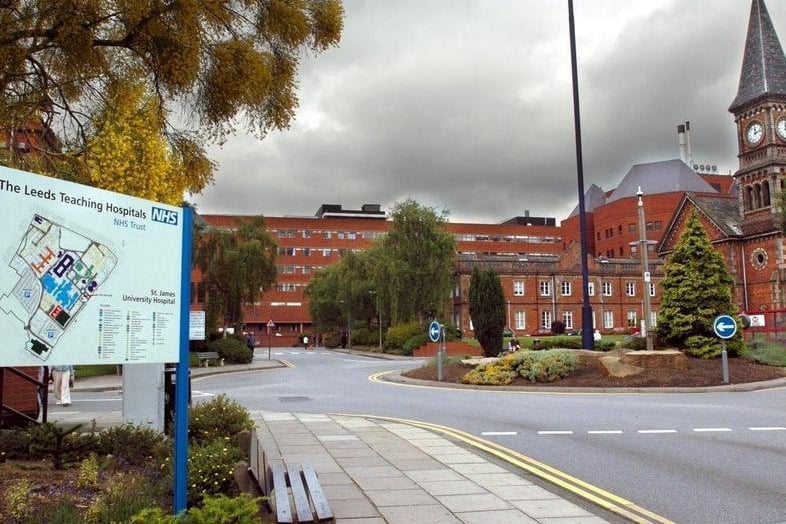
1. Lincoln Green and St James
The biggest price drop was in Lincoln Green and St James where the average price fell to £100,487, down by 35.4% on the year to September 2019. Overall, 22 houses changed hands here between October 2019 and September 2020, a drop of 77% in property sales.
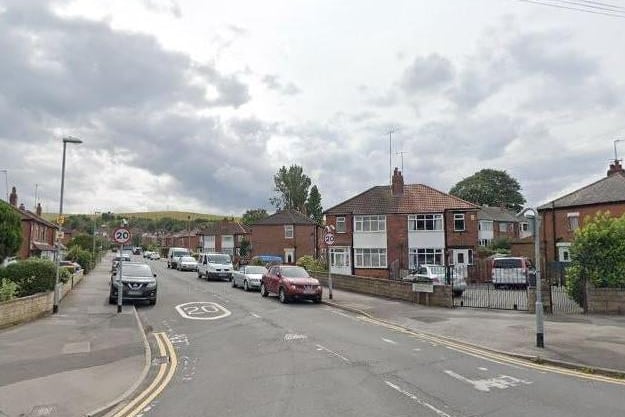
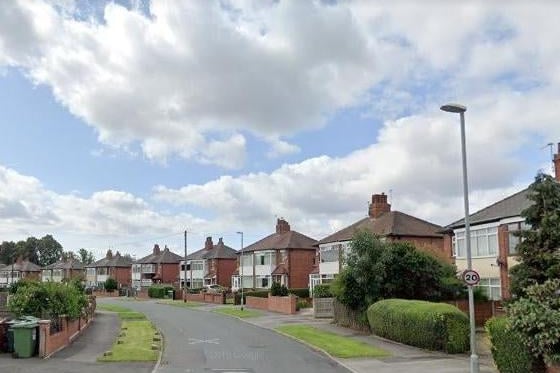
2. New Farnley and Lower Wortley
The second biggest price drop was in New Farnley and Lower Wortley where the average price fell to £158,973, down by 11.1% on the year to September 2019. Overall, 81 houses changed hands here between October 2019 and September 2020, a drop of 40% in property sales. (photo: Google)
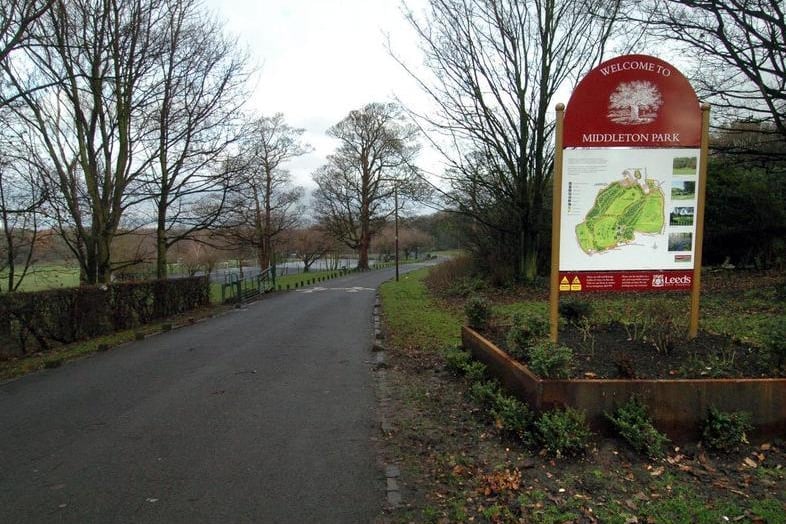
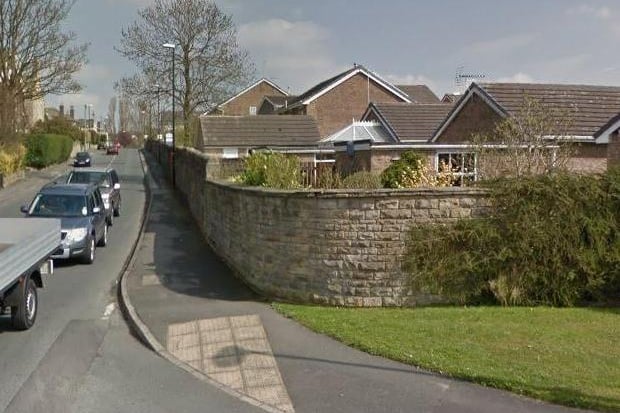
3. Middleton Park Avenue
The third biggest price drop was in Middleton Park Avenue where the average price fell to £115,886, down by 10.6% on the year to September 2019. Overall, 33 houses changed hands here between October 2019 and September 2020, a drop of 52% in property sales.
4. Wetherby East and Thorp Arch
The fourth biggest price drop was in Wetherby East and Thorp Arch where the average price fell to £291,064, down by 9.6% on the year to September 2019. Overall, 117 houses changed hands here between October 2019 and September 2020, a drop of 15% in property sales.
5. Seacroft South
The fifth biggest price drop was in Seacroft South where the average price fell to £153,581, down by 7.1% on the year to September 2019. Overall, 48 houses changed hands here between October 2019 and September 2020, a drop of 55% in property sales.
6. Yeadon West
The sixth biggest price drop was in Yeadon West where the average price fell to £176,045, down by 6.7% on the year to September 2019. Overall, 73 houses changed hands here between October 2019 and September 2020, a drop of 3% in property sales.