

But despite that, average house prices held up across England – even if there was a drop in sales.
It was the same picture in Leeds, where prices rose by 7.1 per cent in the year to September 2020.
The ONS also publishes house price figures by Middle Layer Super Output Areas (MSOAs) – small geographic areas containing an average of 7,200 people.
These figures show that 24 of the 107 MSOAs that make up Leeds actually saw a fall in house prices over the same period.
Here we reveal which neighbourhoods saw their prices fall in the year to September 2020:
Images are for illustrative purposes only.
The ONS also publishes house price figures by Middle Layer Super Output Areas (MSOAs) – small geographic areas containing an average of 7,200 people.
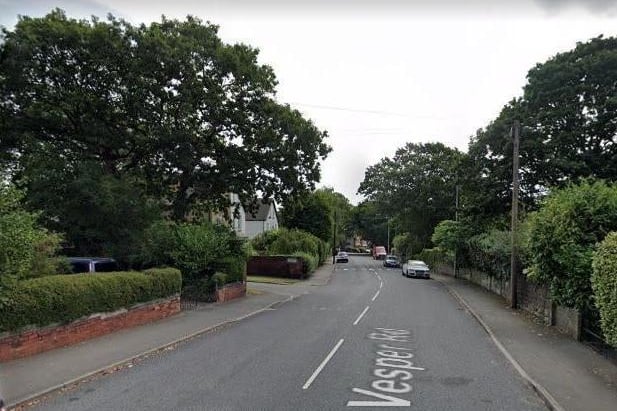
7. Otley North
The seventh biggest price drop was in Otley North where the average price fell to £245,756, down by 6.5% on the year to September 2019. Overall, 69 houses changed hands here between October 2019 and September 2020, a drop of 30% in property sales.
8. Morley Bruntcliffe and Woodkirk
The eighth biggest price drop was in Morley Bruntcliffe and Woodkirk where the average price fell to £195,842, down by 5.5% on the year to September 2019. Overall, 157 houses changed hands here between October 2019 and September 2020, a drop of 18% in property sales.

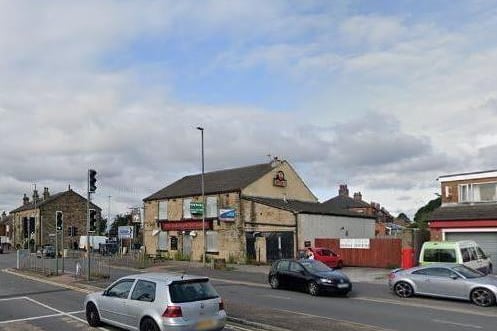
9. Holbeck
The ninth biggest price drop was in Holbeck where the average price fell to £109,282, down by 5.4% on the year to September 2019. Overall, 44 houses changed hands here between October 2019 and September 2020, a drop of 51% in property sales.

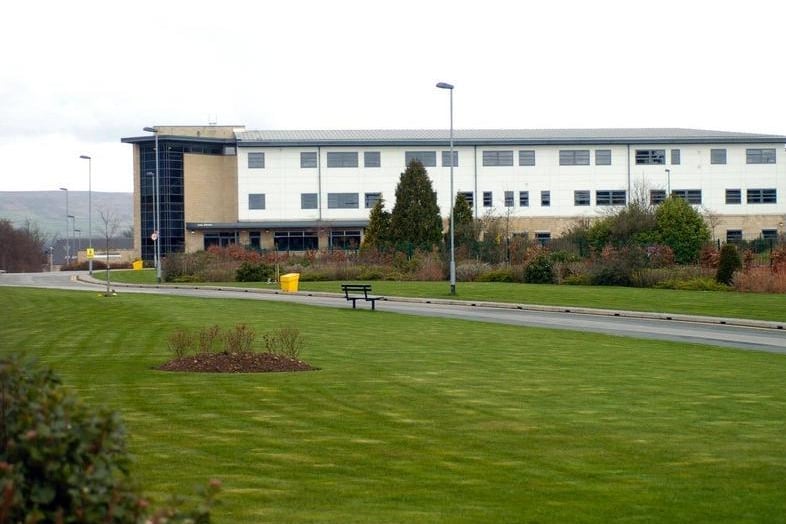
10. Lawnswood and Ireland Wood
The tenth biggest price drop was in Lawnswood and Ireland Wood where the average price fell to £228,085, down by 4.7% on the year to September 2019. Overall, 79 houses changed hands here between October 2019 and September 2020, a drop of 24% in property sales.
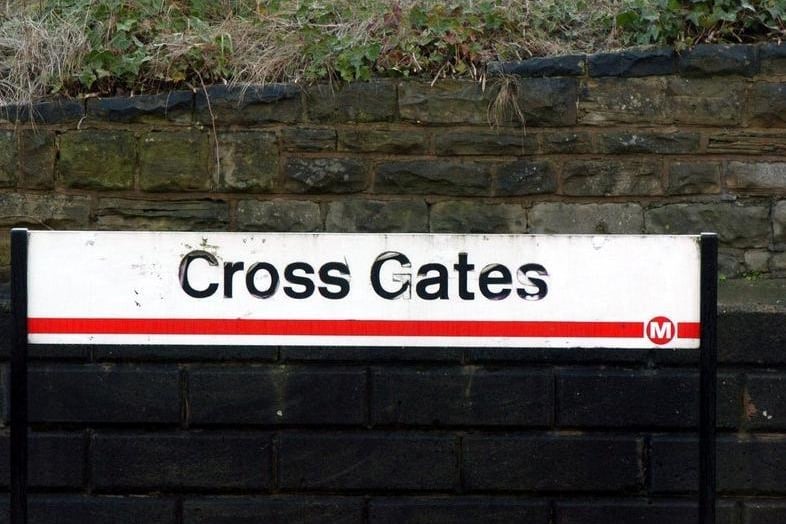
11. Cross Gates West and Killingbeck
The eleventh biggest price drop was in Cross Gates West and Killingbeck where the average price fell to £178,218, down by 3.4% on the year to September 2019. Overall, 91 houses changed hands here between October 2019 and September 2020, a drop of 41% in property sales.
12. Seacroft North and Monkswood
The twelfth biggest price drop was in Lincoln Green and St James where the average price fell to £114,950 down by 2.8% on the year to September 2019. Overall, 34 houses changed hands here between October 2019 and September 2020, a drop of 19% in property sales.