

Bridging Finance London has analysed property prices across the UK and found that, on average, house prices increased by 51.51 per cent from November 2014 to November 2024.
In Yorkshire and the Humber, however, prices have risen even more significantly, with the lowest increase in the region still at 56.19 per cent.
Today, purchasing a property in Leeds would cost nearly £100,000 more than it did just over a decade ago, with the average home in the city now priced at approximately £249,000.
Below are the ten local authorities in Yorkshire and the Humber where house prices have increased the most, along with Leeds' ranking among them.
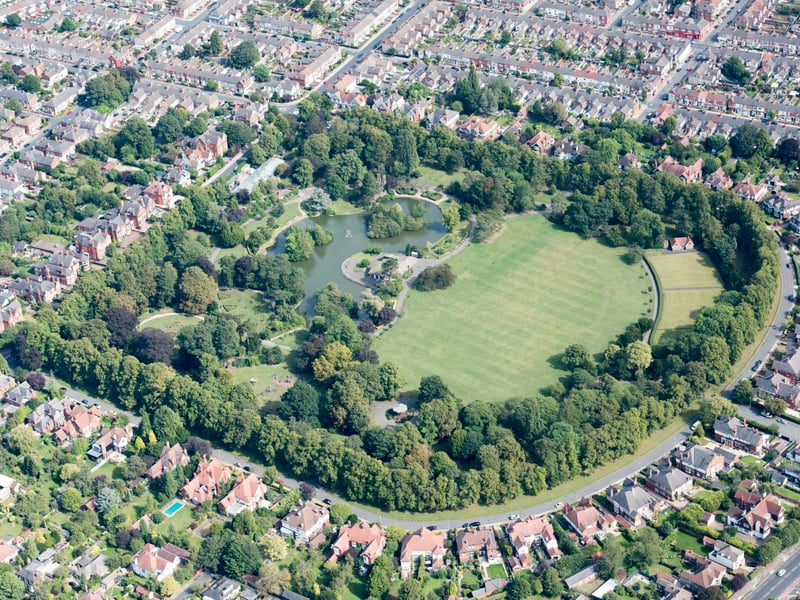
1. North East Lincolnshire - 56.19%
In North East Lincolnshire, house prices rose from an average of £105,478 in November 2014 to £164,749 in November 2024. | Heritage Images via Getty Images
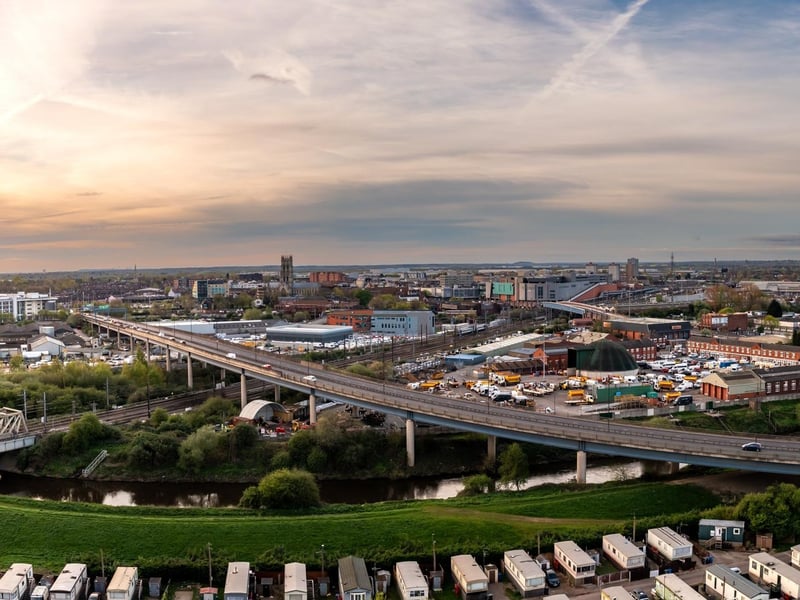
2. Doncaster - 57.11%
In Doncaster, house prices rose from an average of £113,290 in November 2014 to £177,995 in November 2024. | Clare Louise Jackson
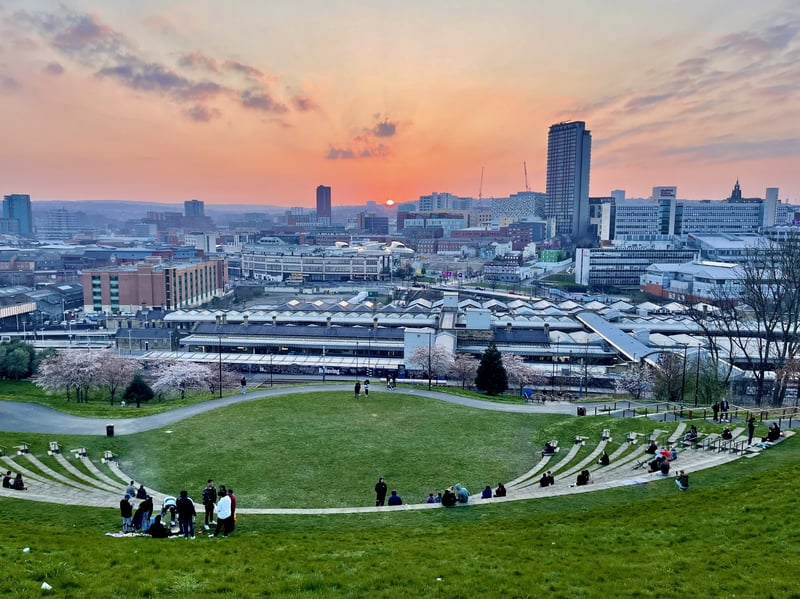
3. Sheffield - 58.97%
In Sheffield, house prices rose from an average of £140,656 in November 2014 to £223,607 in November 2024. | National World
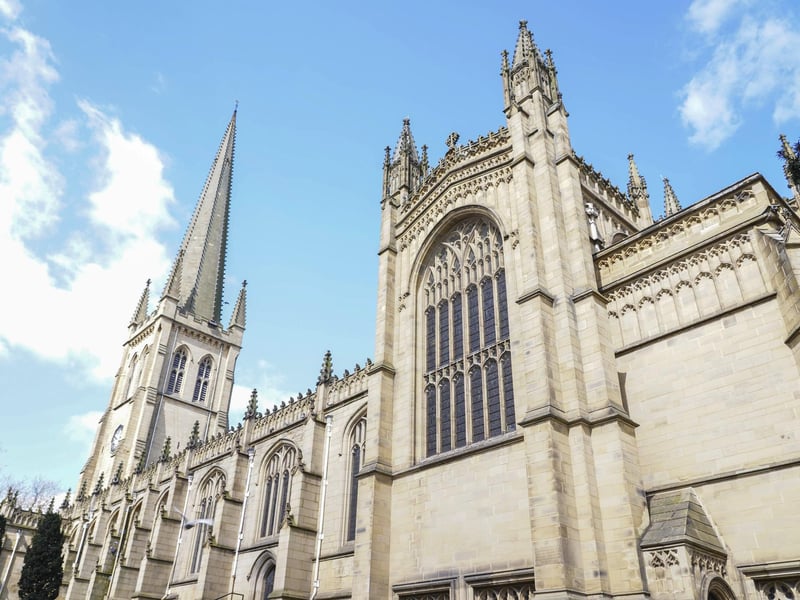
4. Wakefield - 59.19%
In Wakefield, house prices rose from an average of £126,921 in November 2014 to £202,043 in November 2024. | Scott Merrylees
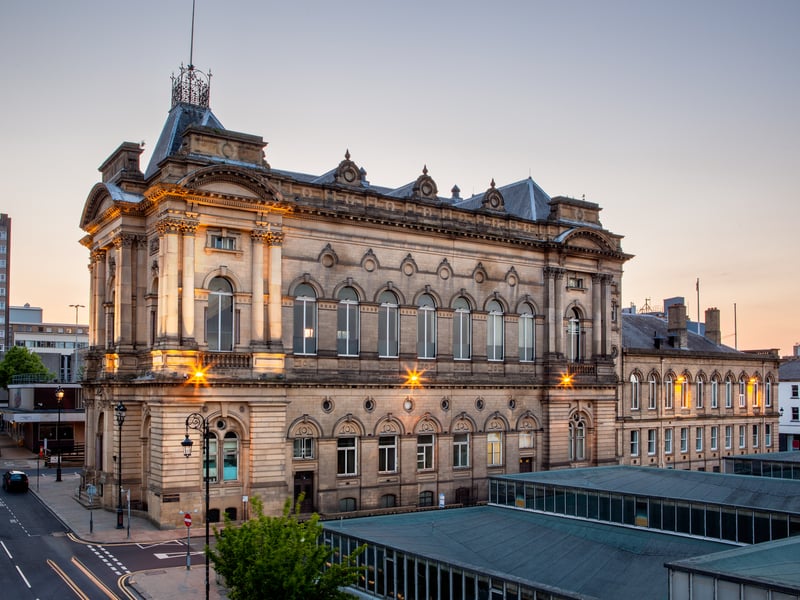
5. Kirklees - 59.52%
In Kirklees, house prices rose from an average of £130,048 in November 2014 to £207,455 in November 2024. | SakhanPhotography - stock.adobe.com
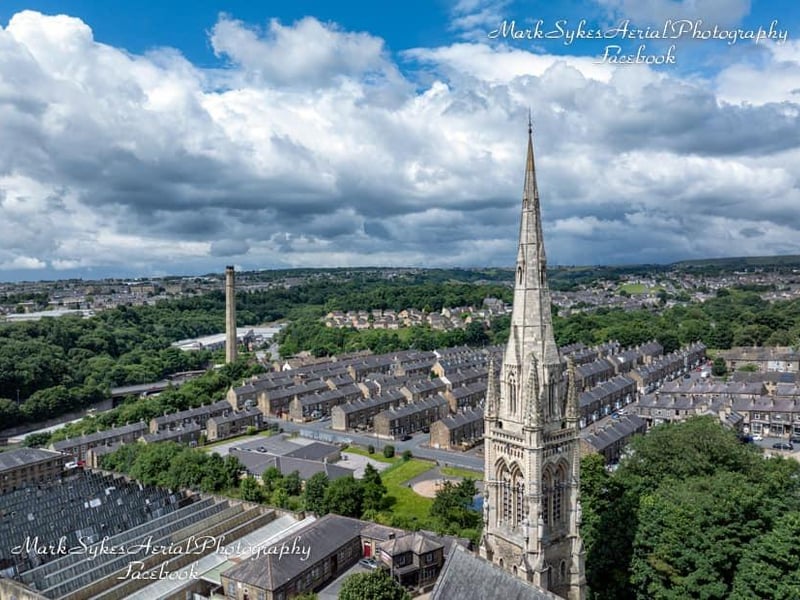
6. Calderdale - 59.69%
In Calderdale, house prices rose from an average of £123,388 in November 2014 to £197,038 in November 2024. | Mark Sykes Photography