The Office for National Statistics (ONS) has released its Coronavirus (COVID-19) Infection Survey results, which estimate the current rates for areas in the UK for the week ending February 28.Reports have emerged in some parts of the UK warning of rising Covid hospital admissions. Here, we look at the latest Covid infection rates in Leeds and how they compare to every area in Yorkshire, ordered from the highest infection rate to the lowest in the region.
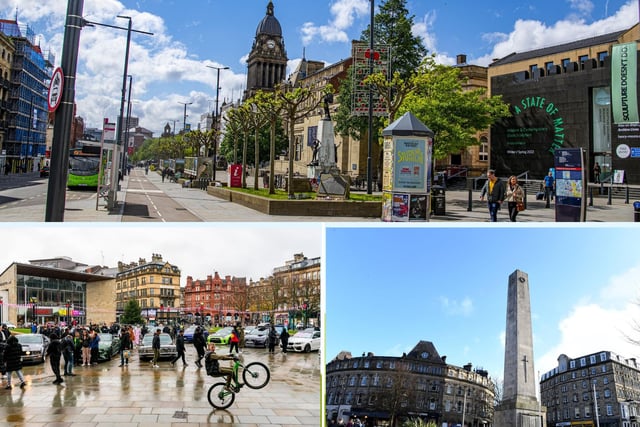
1. Covid rates in Yorkshire
Here, the YEP compares Covid rates in Leeds to every other area in Yorkshire included in the ONS data. The list is ordered from the highest infection rate to the lowest in the region. Photo: Nationalworld
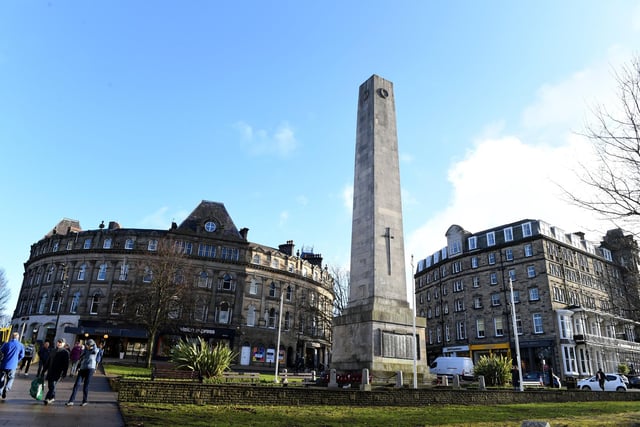
2. North Yorkshire
2.6% tested positive for Covid-19 during the survey, according to the ONS data. It represents a ratio of people testing positive for Covid of 1 in 40. The figures cover Craven, Hambleton, Harrogate, Richmondshire, Ryedale, Scarborough and Selby. Photo: Gerard Binks
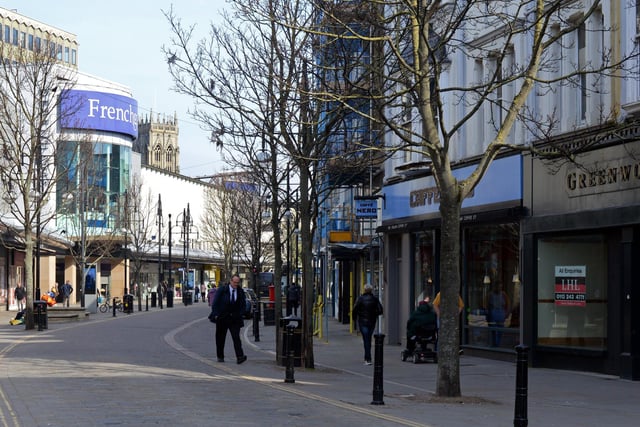
3. North East Lincolnshire/South Yorkshire
2.5% tested positive for Covid-19 during the survey, according to the ONS data. It represents a ratio of people testing positive for Covid of 1 in 40. The figures also cover North Lincolnshire, Doncaster (pictured) and Rotherham. Photo: Marie Caley

4. Bradford
2.5% tested positive for Covid-19 during the survey, according to the ONS data. It represents a ratio of people testing positive for Covid of 1 in 40. Photo: James Hardisty
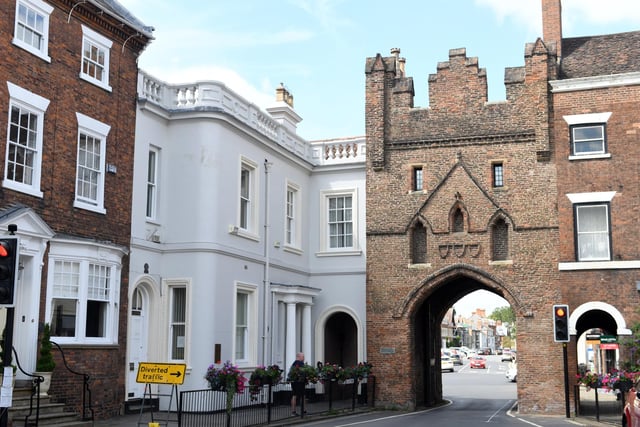
5. East Riding of Yorkshire
2.5% tested positive for Covid-19 during the survey, according to the ONS data. It represents a ratio of people testing positive for Covid of 1 in 40. Photo: Gary Longbottom
6. Barnsley
2.4% tested positive for Covid-19 during the survey, according to the ONS data. It represents a ratio of people testing positive for Covid of 1 in 40. Photo: Yorkshire Post Newspapers