
Some parts of England have seen house prices rocket by as much as 50 per cent or more in just a year, analysis of official figures shows. Almost three quarters of neighbourhoods in England saw an increase in property prices in the year to September 2022, but some have seen hundreds of thousands of pounds added onto the average sale price.
However, there are also areas in which house prices have plummeted, and it is these areas that are explored in this gallery. The Office for National Statistics publishes localised house price figures, based on the HPI, breaking England into 6,809 neighbourhoods known as middle-layer super output areas.
Here, we reveal which neighbourhoods in Leeds have seen the greatest decrease in property prices in the last year. Images are for illustrative purposes only.
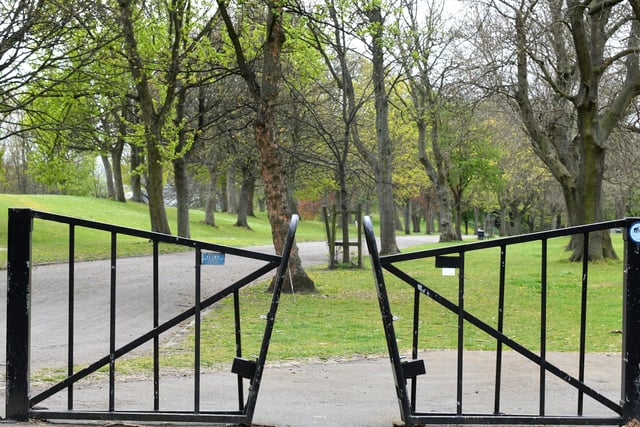
1. East End Park & Richmond Hill
Between September 2021 and September 2022, the average sale price fell by 18.4 per cent. Photo: National World
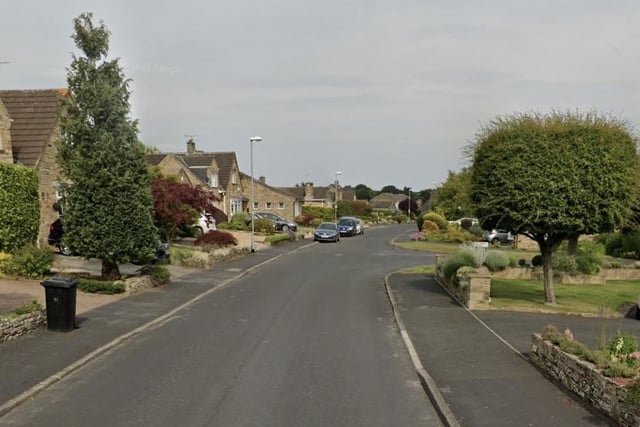
2. Wetherby West
Between September 2021 and September 2022, the average sale price fell by 12.9 per cent. Photo: Google Street View
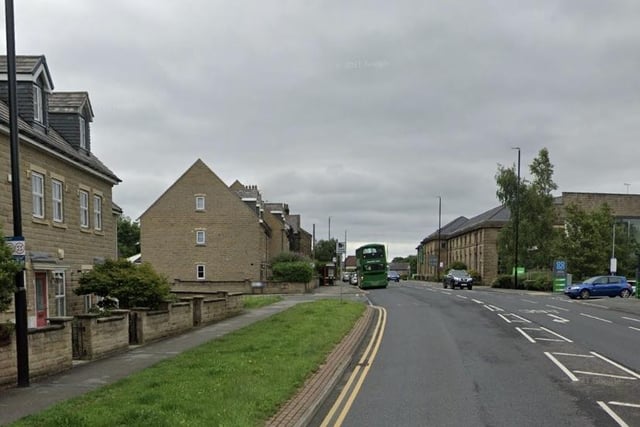
3. Guiseley North & West
Between September 2021 and September 2022, the average sale price fell by 12.1 per cent. Photo: Google Street View
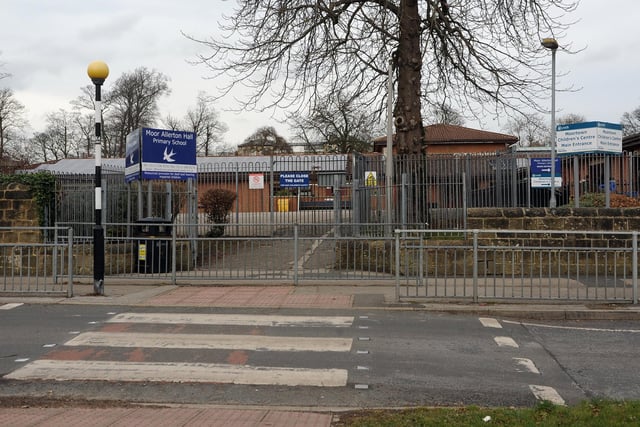
4. Moor Allerton
Between September 2021 and September 2022, the average sale price fell by 11.2 per cent. Photo: Tony Johnson

5. Aberford, Barwick & Thorner
Between September 2021 and September 2022, the average sale price fell by 10.1 per cent. Photo: Simon Hulme
6. Roundhay Park & Slaid Hill
Between September 2021 and September 2022, the average sale price fell by 9.6 per cent. Photo: Tony Johnson