

The latest Government figures show there were 2,154 coronavirus cases recorded in Leeds in the seven days to December 31, an infection rate of 271.6 cases per 100,000 people. That's up 41.9 per cent from the previous seven day period. But infection rates vary across the city's Middle Super Output Areas (MSOA) - a geographic measure of approximately 7,200 people. These 15 neighbourhoods saw the biggest rise in infection rates in the seven days to December 31, compared to the previous week. Images are for illustrative purposes only.
1. Beeston Hill & Hunslet Moor - up 466.7%
Beeston Hill & Hunslet Moor recorded 17 new cases in the seven days to December 31, that’s a rate of 249.4. It’s up 466.7% from the previous week
2. University & Little Woodhouse - up 340%
University & Little Woodhouse recorded 22 new cases in the seven days to December 31, that’s a rate of 191.8. It’s up 340% from the previous week
3. Horsforth South & Rawdon - up 328.6%
Horsforth South & Rawdon recorded 30 new cases in the seven days to December 31, that’s a rate of 360.4. It’s up 328.6% from the previous week
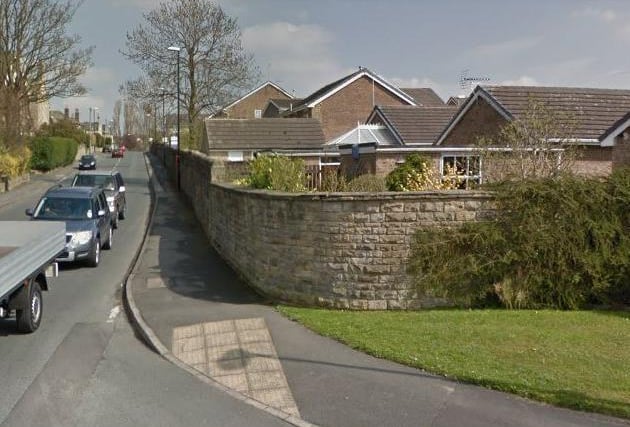
4. Kippax West - up 312.5%
Kippax West recorded 33 new cases in the seven days to December 31, that’s a rate of 478.1. It’s up 312.5% from the previous week Photo: Google
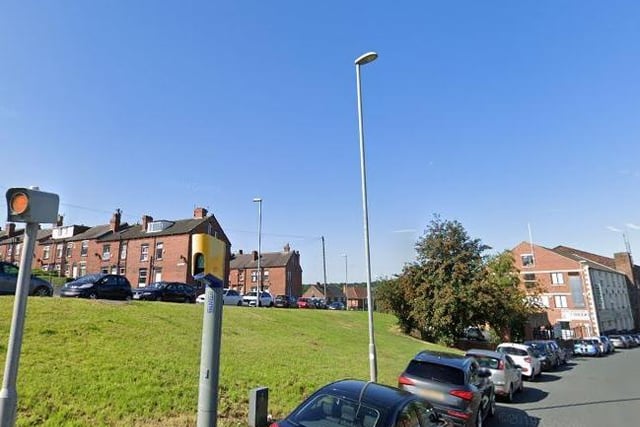
5. Yeadon West - up 275%
Yeadon West recorded 15 new cases in the seven days to December 31, that’s a rate of 280.3. It’s up 275% from the previous week Photo: Google
6. Farnley West & Gamble Hill - up 305.9%
Farnley West & Gamble Hill recorded 18 new cases in the seven days to December 31, that’s a rate of 305.9. It’s up 260% from the previous week Photo: Google