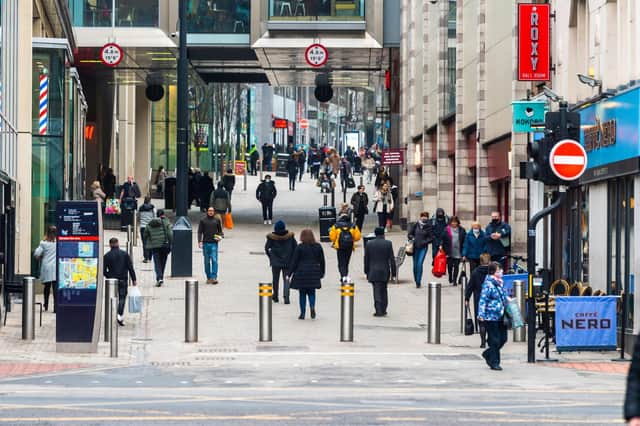
There were 6,887 positive tests across the city in the seven days to February 1, the latest available figures from the Government.
That's an infection rate of 862.2 new cases per 100,000 people, down 27.6 per cent from the previous week.
But infection rates vary across Leeds and 13 neighbourhoods saw rates increase during that period.
Here are the Leeds areas where Covid cases were on the rise in the week to February 1. All images are for illustrative purposes only.
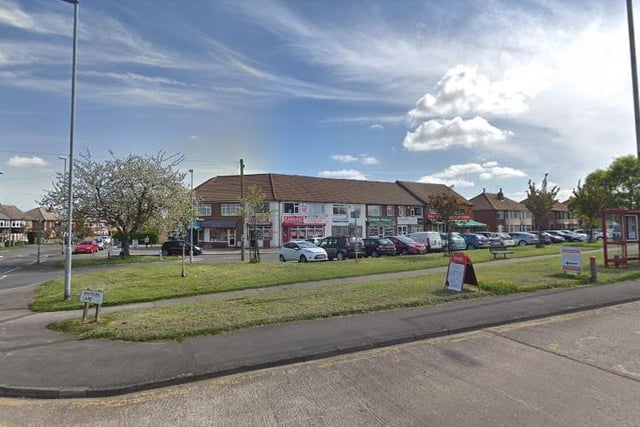
1. Colton, Austhorpe & Whitkirk
Colton, Austhorpe & Whitkirk has an infection rate of 894.4 cases per 100,000 people. That’s up 50% from the previous week. Photo: Google
2. Collingham, Rigton & Harewood
Collingham, Rigton & Harewood has an infection rate of 1,219.8 cases per 100,000 people. That’s up 31.9% from the previous week.
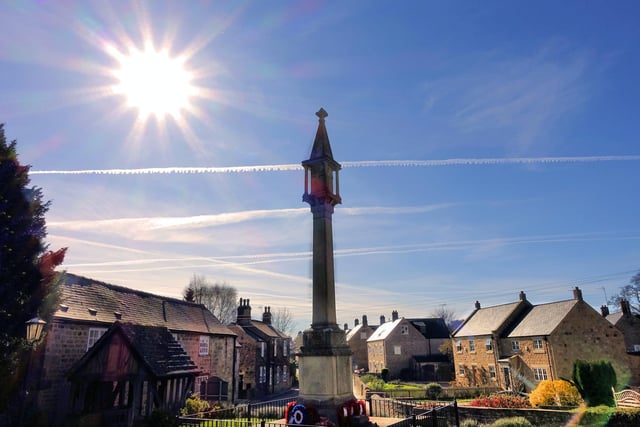
3. Aberford, Barwick & Thorner
Aberford, Barwick & Thorner has an infection rate of 1,311.1 cases per 100,000 people. That’s up 27.3% from the previous week. Photo: Paul Goodyear
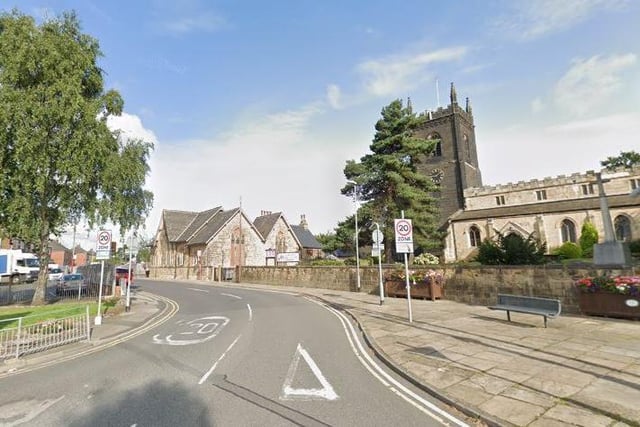
4. Garforth South, Swillington & Little Preston
Garforth South, Swillington & Little Preston has an infection rate of 645 cases per 100,000 people. That’s up 18.9% from the previous week. Photo: Google
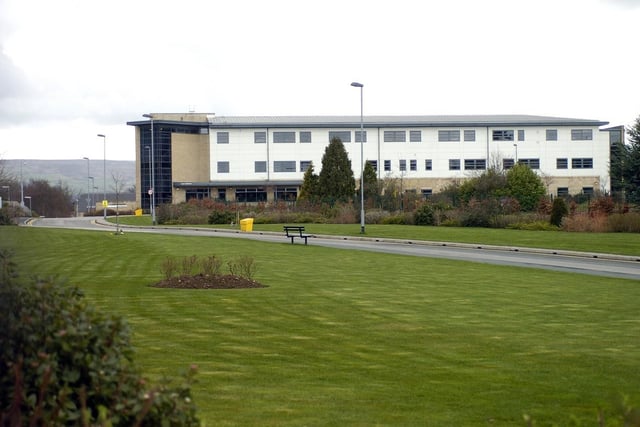
5. Otley North
Otley North has an infection rate of 790.1 cases per 100,000 people. That’s up 16.7% from the previous week.
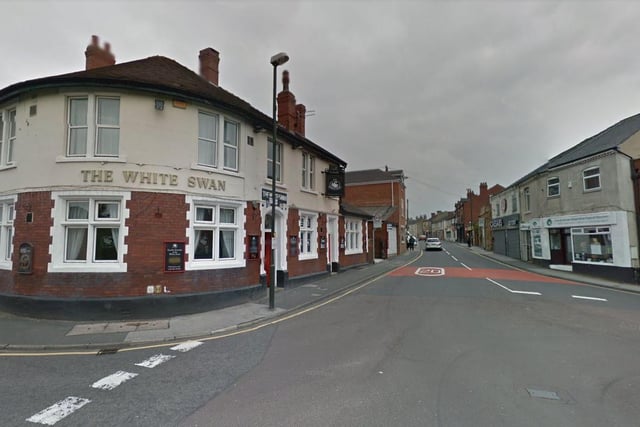
6. Kippax West
Kippax West has an infection rate of 1,369.5 cases per 100,000 people. That’s up 11.8% from the previous week. Photo: Google
