
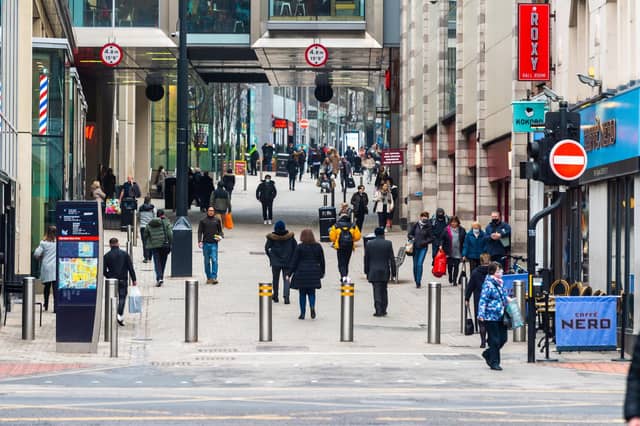

There were 6,887 positive tests across the city in the seven days to February 1, the latest available figures from the Government.
That's an infection rate of 862.2 new cases per 100,000 people, down 27.6 per cent from the previous week.
But infection rates vary across Leeds and 13 neighbourhoods saw rates increase during that period.
Here are the Leeds areas where Covid cases were on the rise in the week to February 1. All images are for illustrative purposes only.
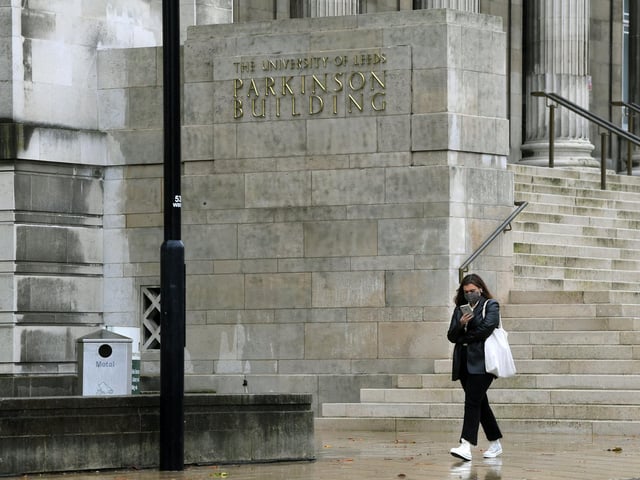
7. University & Little Woodhouse
University & Little Woodhouse has an infection rate of 617 cases per 100,000 people. That’s up 9.1% from the previous week.
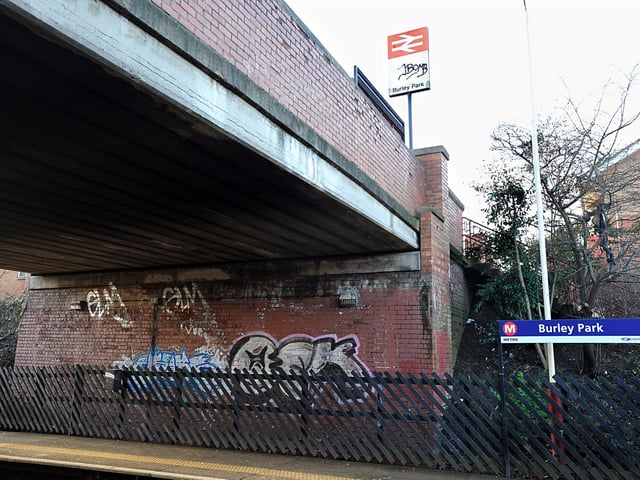
8. Burley
Burley has an infection rate of 668.3 cases per 100,000 people. That’s up 7.2% from the previous week.
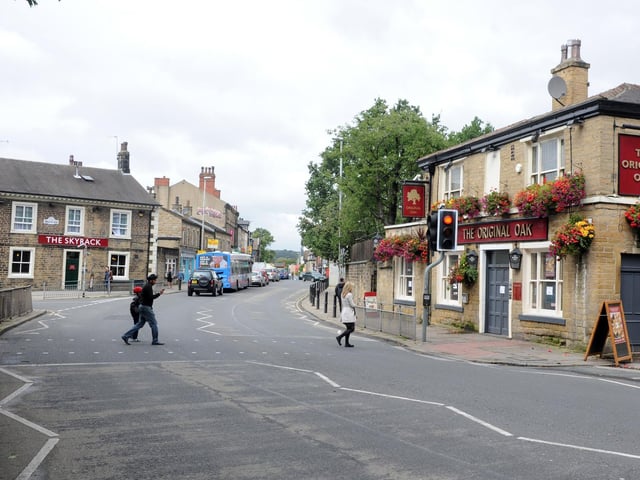
9. Headingley
Headingley has an infection rate of 635.1 cases per 100,000 people. That’s up 5.2% from the previous week.
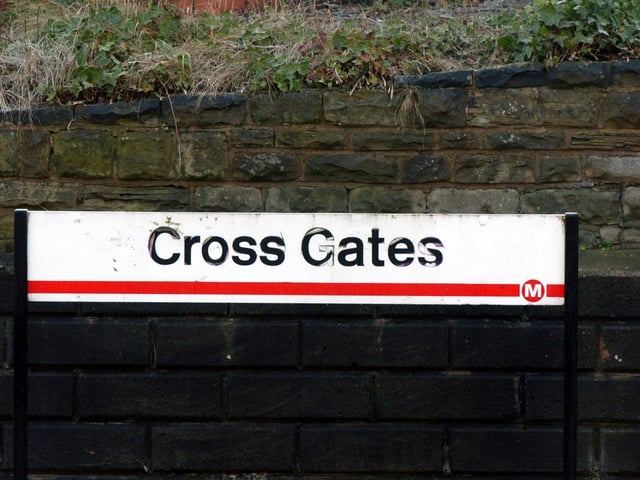
10. Cross Gates East & Manston
Cross Gates East & Manston has an infection rate of 747.8 cases per 100,000 people. That’s up 4.9% from the previous week.
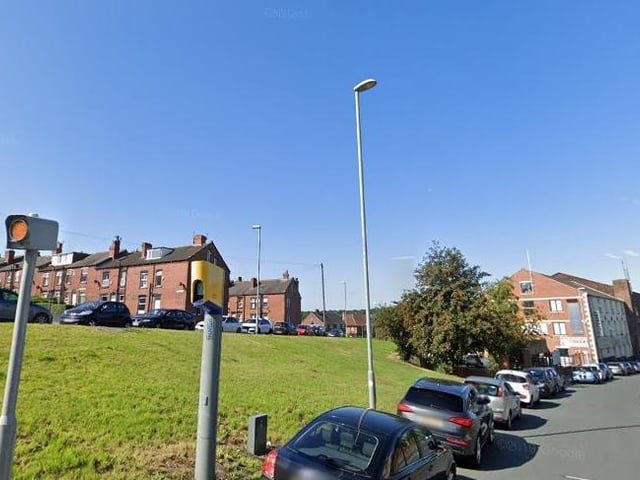
11. Farnley West & Gamble Hill
Farnley West & Gamble Hill has an infection rate of 984.9 cases per 100,000 people. That’s up 3.6% from the previous week. Photo: Google
12. Cross Gates West & Killingbeck
Cross Gates West & Killingbeck has an infection rate of 1,121.5 cases per 100,000 people. That’s up 2.8% from the previous week.