

The city recorded an infection rate of 377.6 new cases per 100,000 people in the seven days to August 17 - down 9.6 per cent from the previous week.
But some Leeds neighbourhoods have much higher rates than the city's average. Here we reveal the Leeds areas with the highest infection rates.
The figures for the seven days to August 17 are based on tests carried out in laboratories (pillar one of the Government’s testing programme) and in the wider community (pillar two). The rate is expressed as the number of new cases per 100,000 people. Images are for illustrative purposes only.
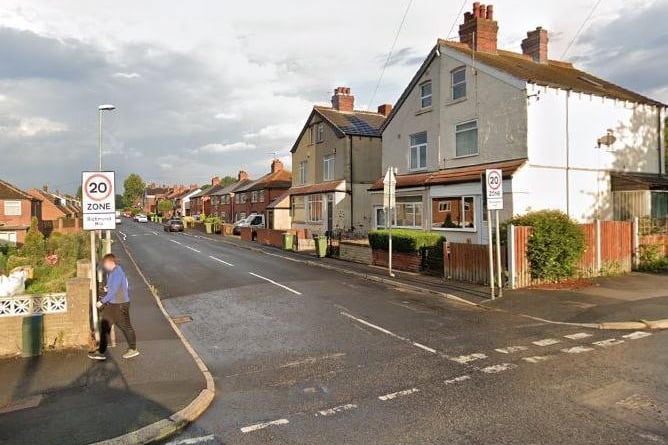
1. Osmondthorpe & Neville Hill
Osmondthorpe & Neville Hill recorded 51 cases, that’s a rate of 833.2. It’s up 50% from the previous week. Photo: Google
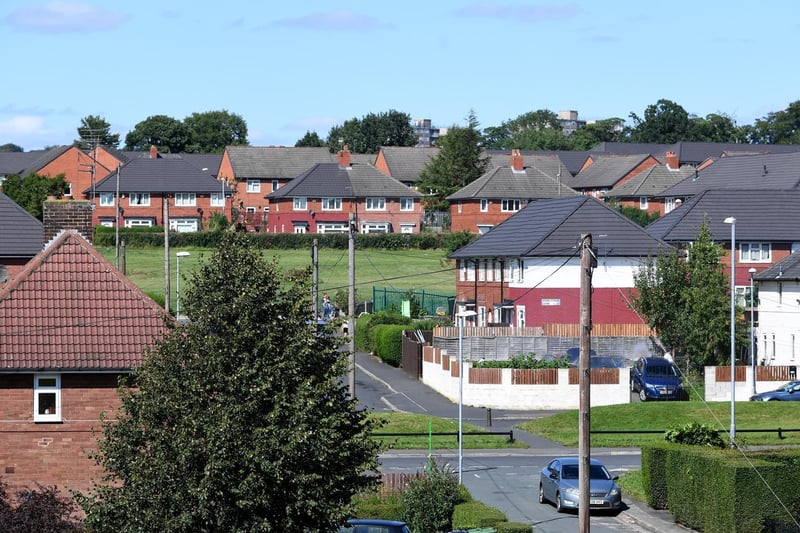
2. Seacroft South
Seacroft South recorded 42 cases, that’s a rate of 755.7. It’s up 7.7% from the previous week.
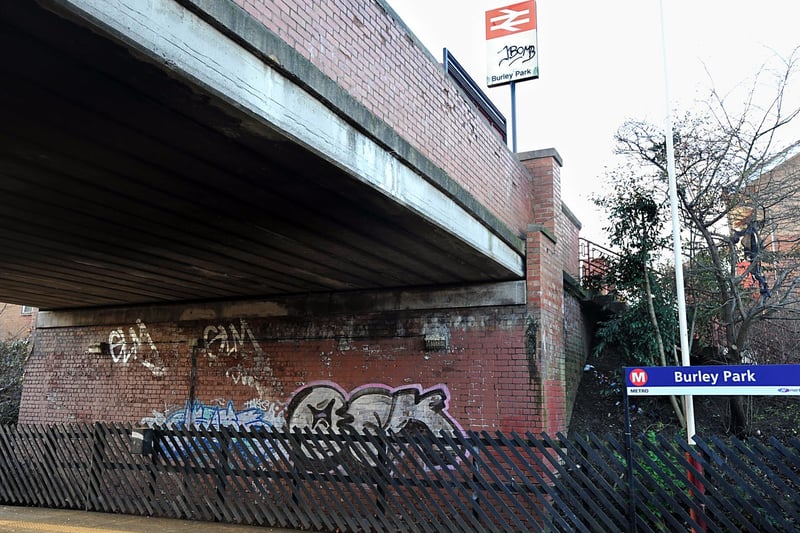
3. Burley
Burley recorded 58 cases, that’s a rate of 662.3. It’s down 6.5% from the previous week.
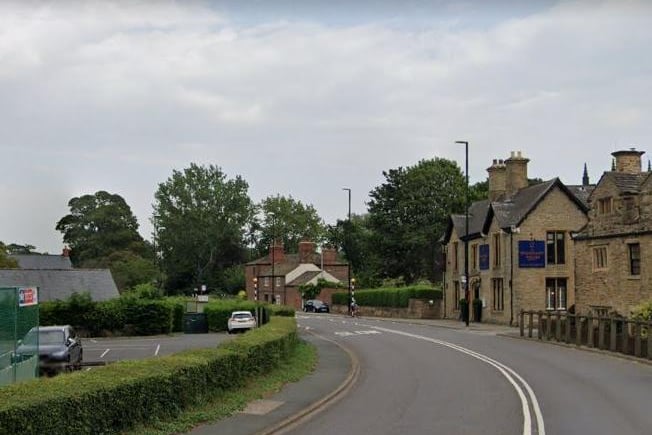
4. Methley
Methley recorded 41 cases, that’s a rate of 572. It’s up 7.9% from the previous week. Photo: Google
5. Belle Isle South
Belle Isle South recorded 32 cases, that’s a rate of 559.4. It’s up 23.1% from the previous week.
6. Cookridge & Holt Park
Cookridge & Holt Park recorded 30 cases, that’s a rate of 537.7. It’s up 57.9% from the previous week. Photo: Google