
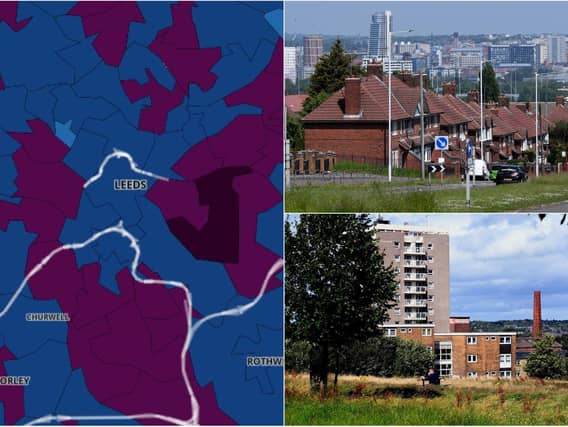

The city recorded an infection rate of 377.6 new cases per 100,000 people in the seven days to August 17 - down 9.6 per cent from the previous week.
But some Leeds neighbourhoods have much higher rates than the city's average. Here we reveal the Leeds areas with the highest infection rates.
The figures for the seven days to August 17 are based on tests carried out in laboratories (pillar one of the Government’s testing programme) and in the wider community (pillar two). The rate is expressed as the number of new cases per 100,000 people. Images are for illustrative purposes only.
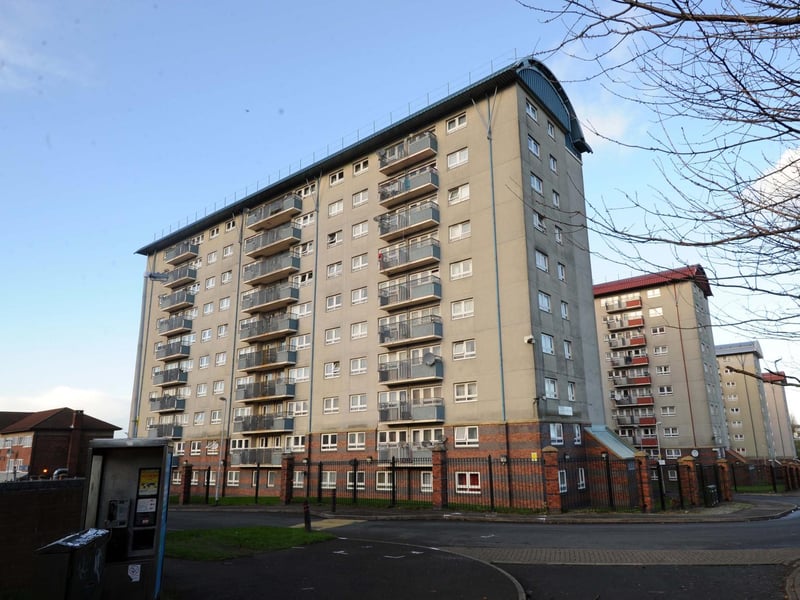
7. Burmantofts
Burmantofts recorded 44 cases, that’s a rate of 528.8. It’s up 83.3% from the previous week.
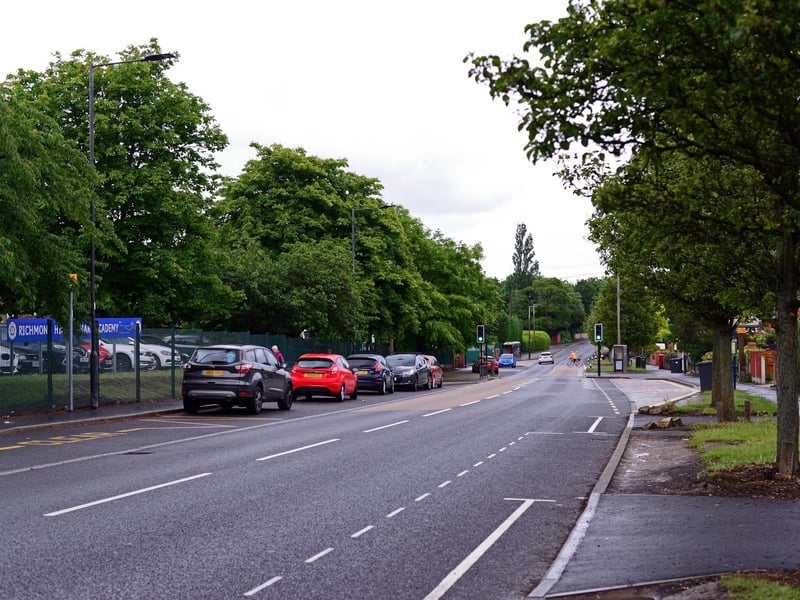
8. East End Park & Richmond Hill
East End Park & Richmond Hill recorded 57 cases, that’s a rate of 527.4. It’s down 8.1% from the previous week.
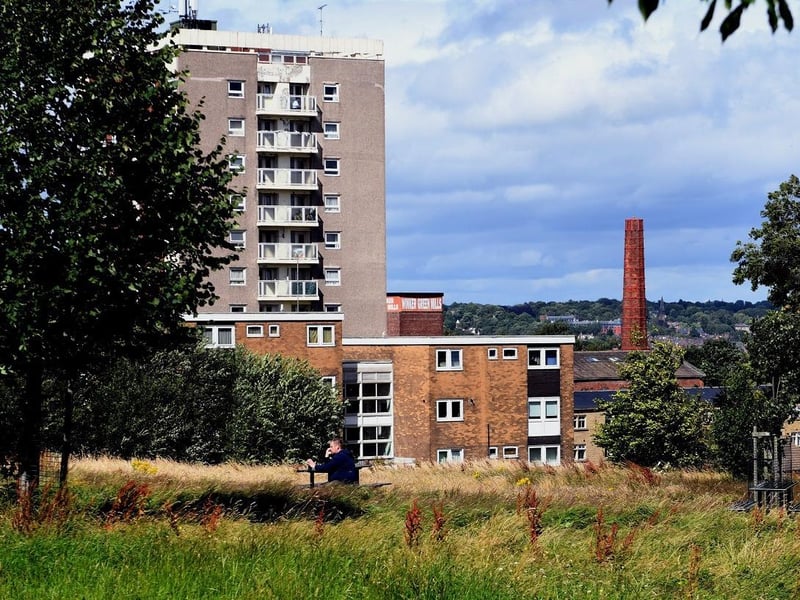
9. Armley & New Wortley
Armley & New Wortley recorded 46 cases, that’s a rate of 522.2. It’s down 14.8% from the previous week.
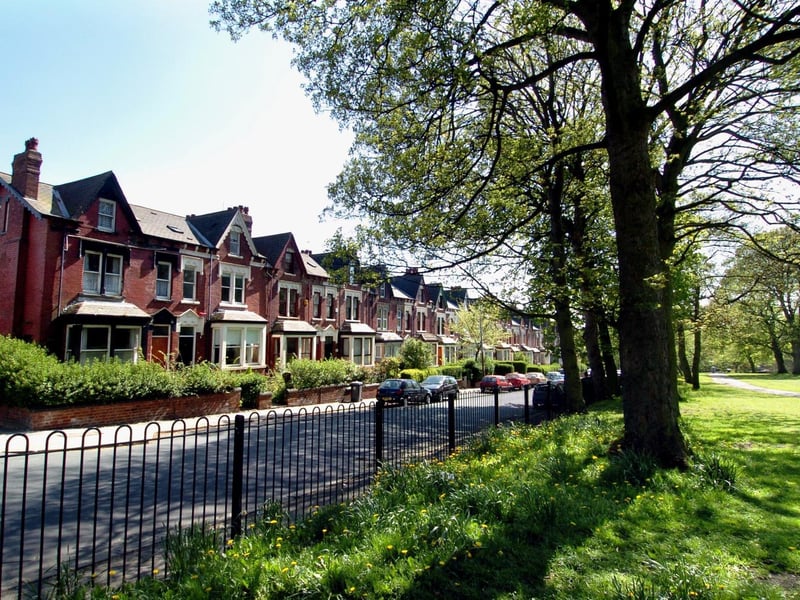
10. Chapel Allerton South & Chapeltown
Chapel Allerton South & Chapeltown recorded 52 cases, that’s a rate of 509.1. It’s down 5.5% from the previous week.
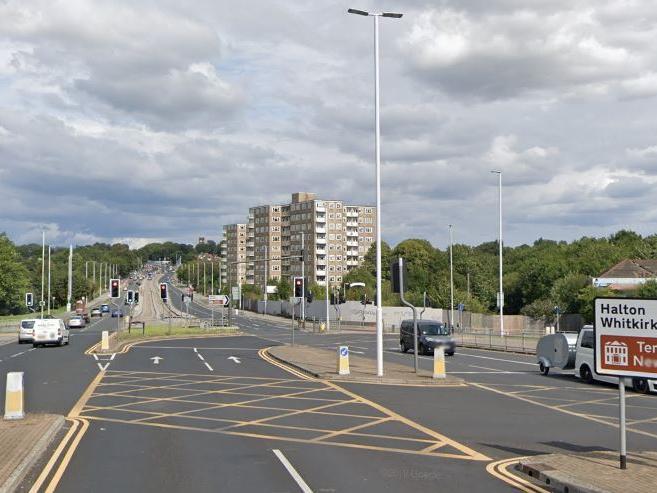
11. Cross Gates West & Killingbeck
Cross Gates West & Killingbeck recorded 32 cases, that’s a rate of 504.3. It’s up 6.7% from the previous week. Photo: Google
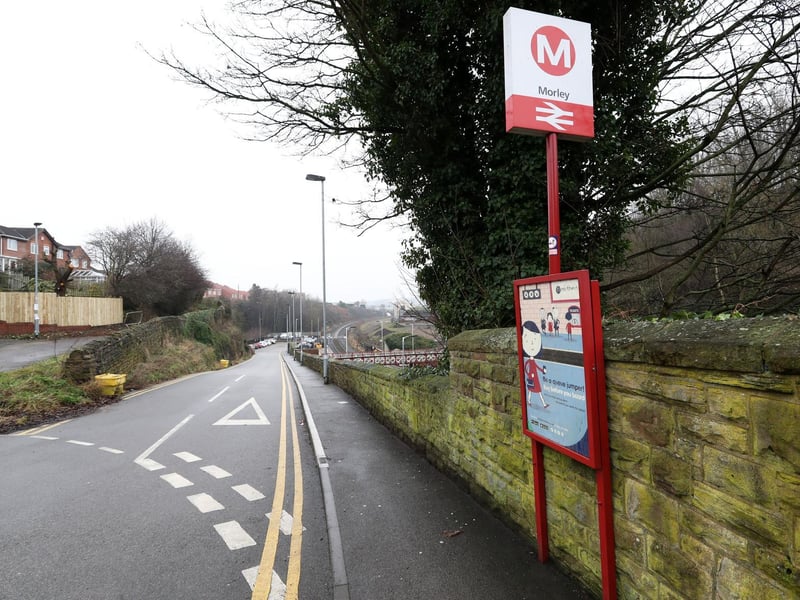
12. Morley Central
Morley Central recorded 32 cases, that’s a rate of 497.3. It’s up 14.3% from the previous week.