
What A-Level results tell us: Stats and slideshow
Today’s A-Level results in numbers...
• There were 850,749 entrants for the exams, up 2% on last year’s total.

• The overall A*-E pass rate was 98.1%, up 0.1 percentage points on last year. This reverses the 0.1-point decline in 2014, which was the first time the pass rate had fallen since 1982.
• The number of candidates receiving top grades has fallen for the fourth year in a row. Entrants scoring either an A or A* was 25.9%, down from 26% in 2014.
• 8.2% of entrants received an A*, the same figure as last year.
• The gap between girls and boys receiving the top grades has narrowed to its smallest for at least 10 years. The number of girls who got A or higher was 0.4 percentage points more than the number of boys. In 2005 the gap was 2.4 percentage points.
• The most popular subject this year was maths. It was taken by 92,711 students, a rise of 4.4% on 2014.
• English was the second most popular subject. It was taken by 89,499 students, a rise of 4.9% on 2014. The third most popular subject was biology, taken by 63,275 students, a drop of 1.2% on last year.
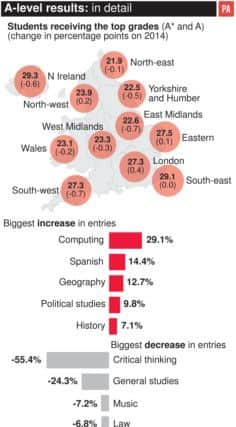
• General studies saw the biggest drop in candidates of any subject with more than 1,000 entrants. The number fell by just under a quarter (24.3%).
• Critical thinking saw the biggest drop in candidates for any subject, falling by 55.4%.
• Computing saw the biggest jump in entrants, rising by 29.1% on 2014.
• Just over three-quarters of the overall rise in entrants was due to an increase in female candidates. There were a total of 13,415 more female entrants in 2015 than in 2014. This compares with 3,527 more male candidates.
• South-west England and the East Midlands saw the biggest year-on-year fall in the number of candidates receiving grade A or above, both dropping 0.7 percentage points.
• Eastern England, north-west England and London were the only regions to see an increase in the number of candidates receiving grade A or above, rising 0.1, 0.2 and 0.4 percentage points respectively.