


Ranked from worst performing to best performing, this is how all 33 Leeds districts compare on children meeting normal academic standards at school in KS2 - years 3 to 6. The full statistics can be found on the Leeds Observatory site.
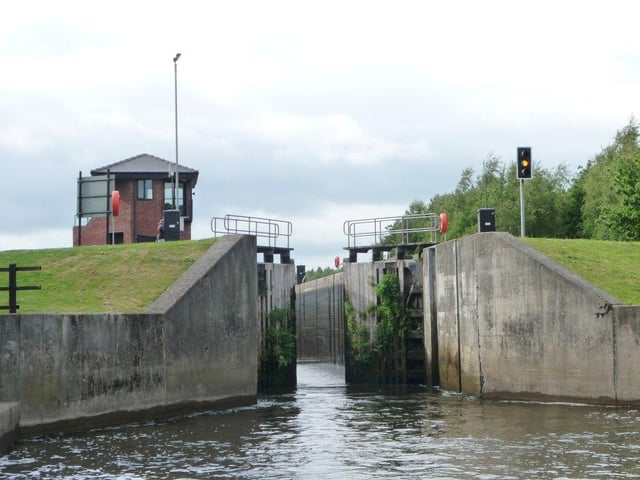
13. Kippax and Methley
In Kippax and Methley, 57.1 per cent of school children achieved the expected standard at KS2. | other Photo: Christine Johnstone (cc-by-sa/2.0)
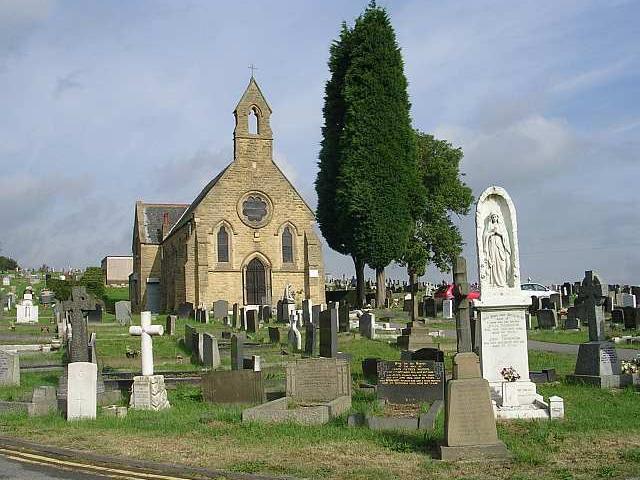
14. Killingbeck and Seacroft
Just below the Leeds average, 60.1 per cent children in Killingbeck and Seacroft achieved the standard expected of them in school | other Photo: Betty Longbottom (cc-by-sa/2.0)
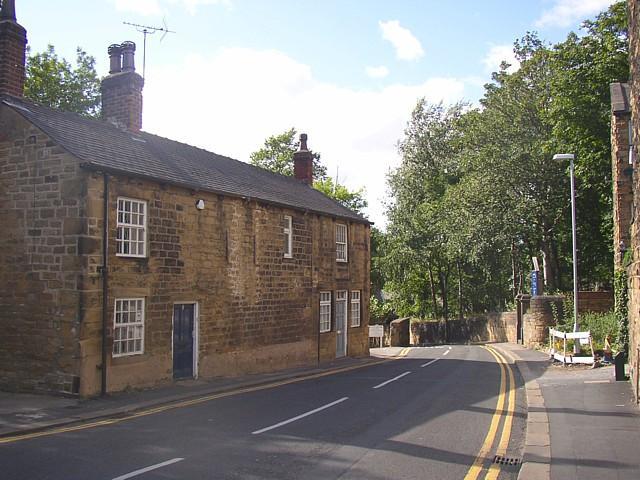
15. Morley North
Morley North comes in above the Leeds average, with 63.1 per cent of children in the ward achieving the expected standard in KS2. | other Photo: Humphrey Bolton (cc-by-sa/2.0)
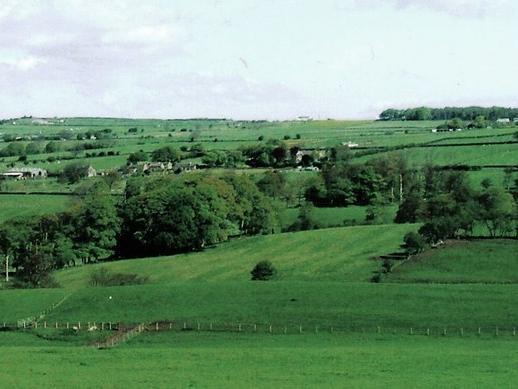
16. Otley and Yeadon
In KS2 in Otley and Yeadon, 63.6 per cent of children achieved the expected standard at school. | other Photo: Hugh Chappell (cc-by-sa/2.0)
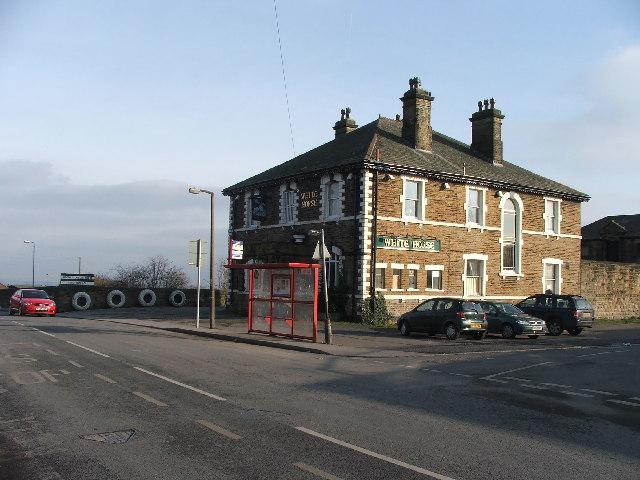
17. Ardsley and Robin Hood
Ardsley and Robin Hood was another Leeds ward that trumped the citys overall average, with 63.6 per cent of children there achieving the expected standard. | other Photo: Steve Partridge (cc-by-sa/2.0)
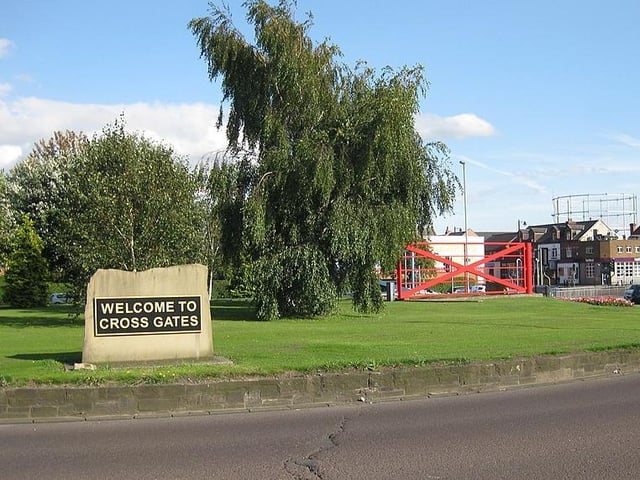
18. Cross Gates and Whinmoor
In Cross Gates and Whinmoor, 64.1 per cent of school children achieved the standard expected of them in KS2. | other Photo: Chemical engineer