


Ranked from worst performing to best performing, this is how all 33 Leeds districts compare on children meeting normal academic standards at school in KS2 - years 3 to 6. The full statistics can be found on the Leeds Observatory site.
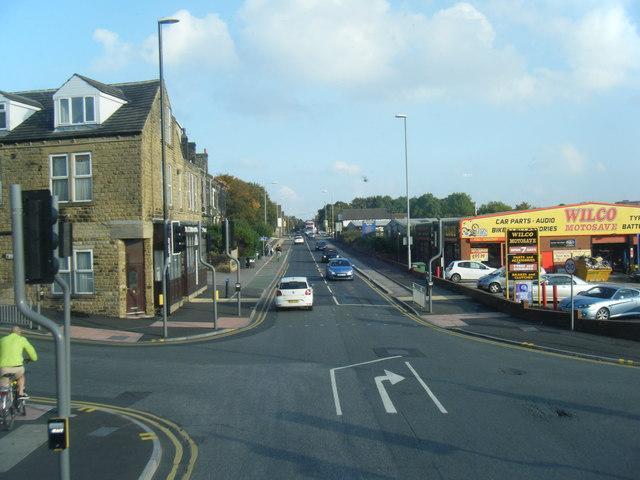
7. Bramley and Stanningley
Bramley and Stanningley saw similarly low levels of achievement, with just 53.7 per cent of children in the ward achieving the standard expected of them in KS2. | other Photo: Colin Pyle (cc-by-sa/2.0)
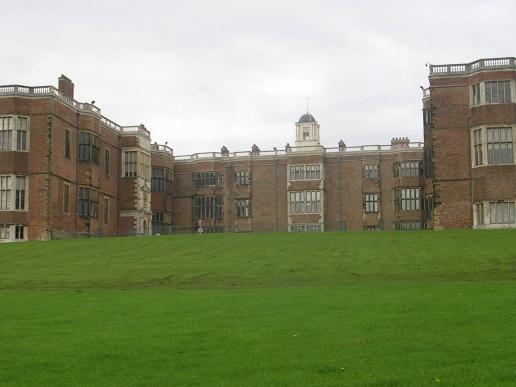
8. Temple Newsam
Just ahead of Bramley and Stanningley was Temple Newsam, where 53.8 per cent of school children hit the standard expected of them in school. | other Photo: Betty Longbottom (cc-by-sa/2.0)
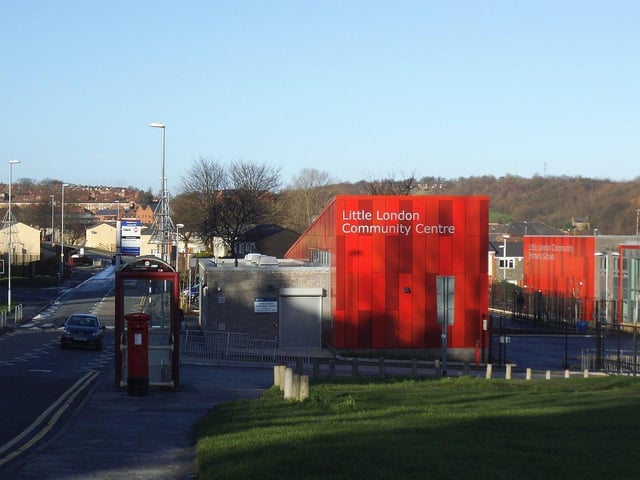
9. Little London and Woodhouse
54.7 per cent of children going to school in Little London and Woodhouse achieved the standard expected of them at school. | other Photo: Stephen Craven (cc-by-sa/2.0)
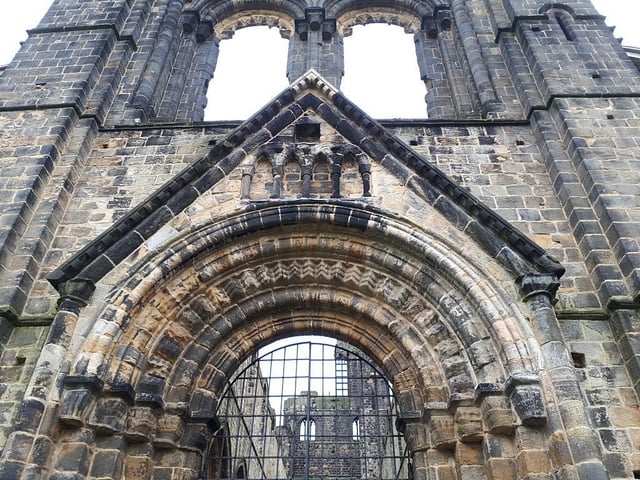
10. Kirkstall
In Kirkstall 55.4 per cent children in KS2 achieved the standard expected of them academically. | other Photo: Stephen Craven (cc-by-sa/2.0)
11. Farnley and Wortley
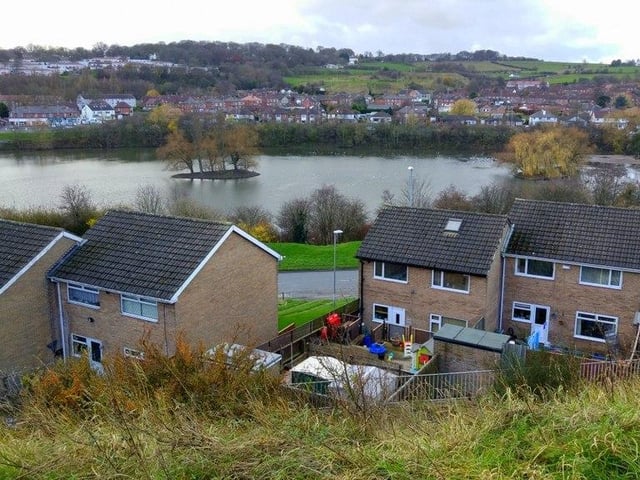
A little better performing than Kirkstall - though still below the Leeds average - Farnley and Wortley saw 56.8 per cent of children in the district achieve the expected standard at school. | other Photo: Mark Stevenson (cc-by-sa/2.0)
12. Beeston and Holbeck
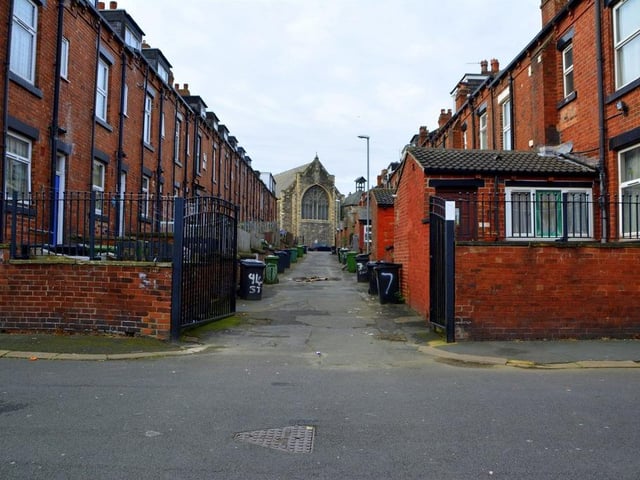
Beeston and Holbeck tied with Farnley and Wortley, with 56.8 per cent of kids in the district achieving the expected standard in KS2. | other Photo: Mark Stevenson (cc-by-sa/2.0)