



Leeds United are heading towards their Premier League survival run-in with plenty of confidence following their 2-2 draw at Chelsea earlier this week. The Whites maintained their six-point gap on 18th-placed West Ham in the process, also climbing above Tottenham Hotspur into 15th.
A round of fixtures in which almost everything went Leeds’ way also saw Nottingham Forest, Crystal Palace and Brighton drop points with up to six teams still at risk of joining Burnley and Wolves in the bottom three. But if Daniel Farke’s side can come through upcoming games against Manchester City and Aston Villa in a good place, confidence will grow further.
With that in mind and using data from Soccerstats, the YEP has analysed the difficulty of each Premier League team’s 12-game run-in according to the points-per-game (PPG) average of those left to play. And in comparing it to the PPG of those already faced, provided a percentage change between opponents played and those left to play.

7. Bournemouth
Opponents played PPG: 1.34 | Opponents remaining PPG: 1.55 | Played vs Remaining difference: -16% | Getty Images

8. Chelsea
Opponents played PPG: 1.34 | Opponents remaining PPG: 1.58 | Played vs Remaining difference: -18% | Getty Images Photo: Getty Images
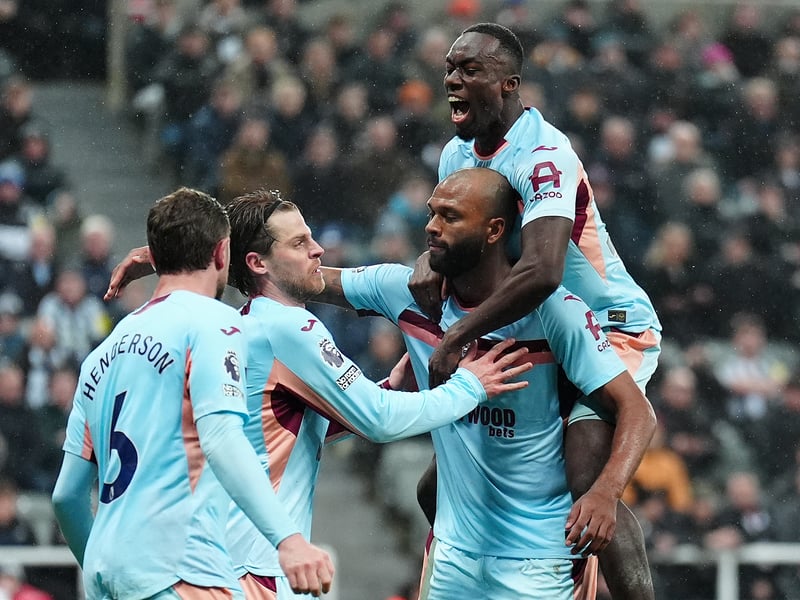
9. Brentford
Opponents played PPG: 1.33 | Opponents remaining PPG: 1.72 | Played vs Remaining difference: -29% | Owen Humphreys/PA Wire

10. Fulham
Opponents played PPG: 1.37 | Opponents remaining PPG: 1.34 | Played vs Remaining difference: +2% | Getty Images

11. Everton
Opponents played PPG: 1.39 | Opponents remaining PPG: 1.16 | Played vs Remaining difference: +17% | Peter Byrne/PA Wire

12. Sunderland
Opponents played PPG: 1.39 | Opponents remaining PPG: 1.24 | Played vs Remaining difference: +11% | Getty Images