
Watch how Covid spread through Leeds in 2020 and which areas have seen the most cases in new hotspots video

This new interactive graphic reveals which areas of Leeds have been hit hardest by Covid – and how case outbreak hotspots have changed since the outbreak began in March.
The JPIMedia Data Unit has crunched the Government’s weekly figures to create a map showing how coronavirus has spread across the city throughout 2020.
You can explore the map in more detail below, or watch it in the video at the top of the page.
The city is divided into 107 areas known as 'Middle Layer Super Output Areas' – a small geographical unit which usually contains about 7,200 people, often used in official statistics.
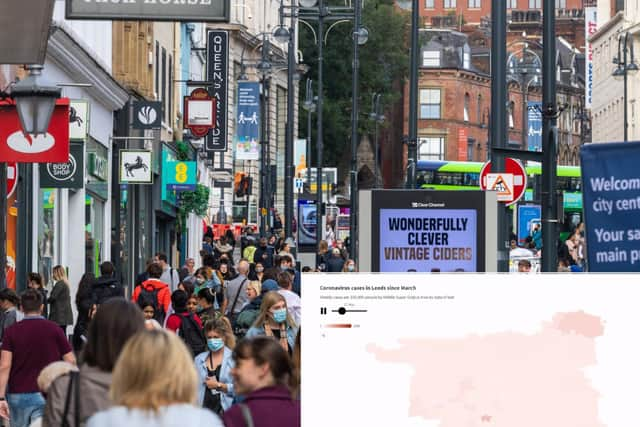

The areas are shaded according to how many coronavirus cases per 100,000 people were recorded in seven-day blocks between the weeks ending March 18th to November 18th.
The time series reveals how a higher number of cases have been recorded across the city during the second wave of the pandemic.
However, far more tests are now being carried out, which means fewer cases are going undetected, unlike during the first wave when most people could not get a test even if they had symptoms.
Hyde Park – an area popular with students – has seen the single highest coronavirus rate to date, with 4,287 cases per 100,000 people recorded in the seven days to October 7th.
Weeks in which an area recorded between zero and two cases are left blank in the data, so will appear as a zero in the map.
The disease was almost eradicated in most parts of the city in the week ending 22 July, with just two areas recording more than two cases.
But every area has recorded cases for the past seven consecutive weeks, with a low of 54 per 100,000 recorded in Yeadon East in the seven days to October 7th.
Play, pause and hover over areas in the graphic below to see how many cases there have been where you live.