

The infection rate, the number of new cases per 100,000 people, was recorded at 286.8 in the seven days to January 17. It's down from 323.5 the previous week. While the rate is showing a positive downward trend, infection rates vary across the Middle Super Output Areas (MSOA) in Leeds - a geographic measure of approximately 8,000 people. These 13 Leeds neighbourhoods had the highest infection rates in the city in the seven days to January 16, the latest available figures. All images are for illustrative purposes only.
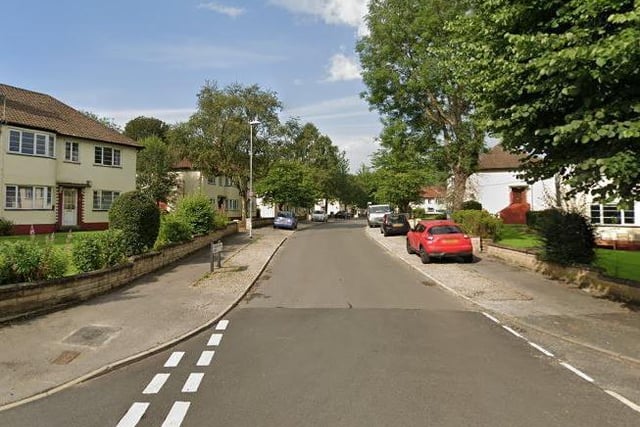
1. Moor Allerton
Moor Allerton had 42 new cases in the seven days to January 16 - that’s a rate of 669 per 100,000 people. It's up 90.9% from the previous week.
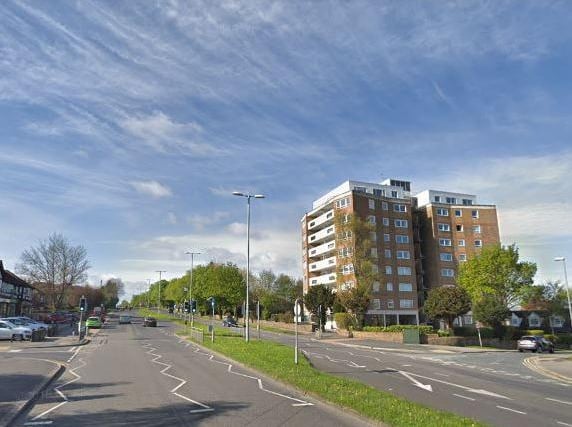
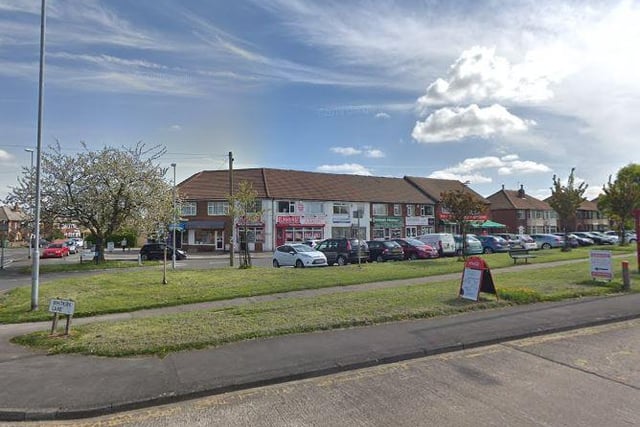
2. Primley Park & Wigton Moor
Primley Park & Wigton Moor had 43 new cases in the seven days to January 16 - that’s a rate of 568.3 per 100,000 people. It's up 79.2% from the previous week. Photo: Google
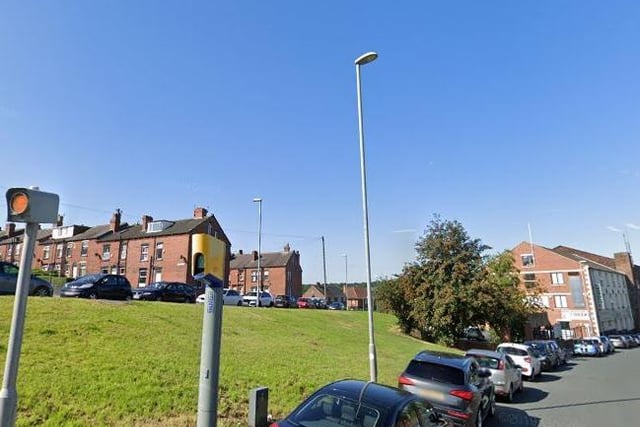
3. Farnley West & Gamble Hill
Farnley West & Gamble Hill had 32 new cases in the seven days to January 16 - that’s a rate of 543.8 per 100,000 people. It's up 113.3% from the previous week. Photo: Google
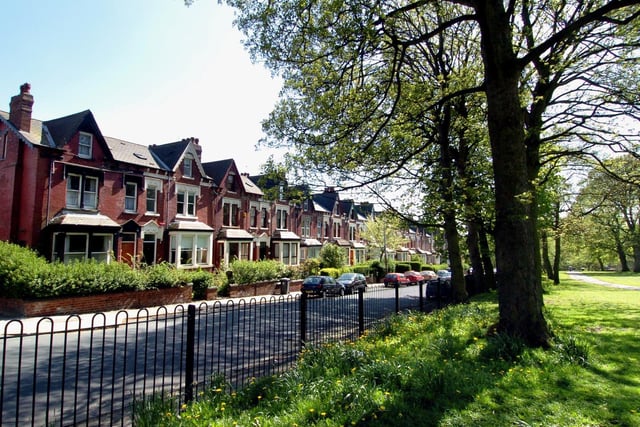
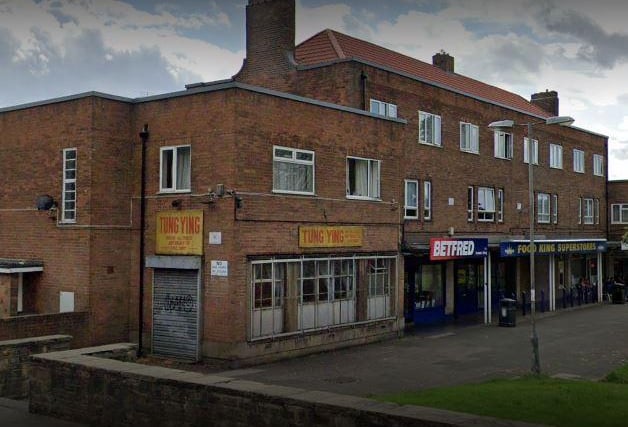
4. Chapel Allerton South & Chapeltown
Chapel Allerton South & Chapeltown had 55 new cases in the seven days to January 16 - that’s a rate of 538.4 per 100,000 people. It's down 1.8% from the previous week.
5. Swarcliffe
Swarcliffe had 38 new cases in the seven days to January 16 - that’s a rate of 538.9 per 100,000 people. It's up 58.3% from the previous week. Photo: Google
6. Colton, Austhorpe & Whitkirk
Colton, Austhorpe & Whitkirk had 27 new cases in the seven days to January 16 - that’s a rate of 497.5 per 100,000 people. It's up 17.4% from the previous week. Photo: Google