

There were 266.3 new cases per 100,000 people in the last seven days, down from 419.6 the previous week. The council hopes the city can move down to Tier 2 measures when tiers are reviewed on December 16.
Government figures have tracked which Leeds areas were worst hit with Covid cases during the second wave of the virus. The data has tracked the infection rate in every Middle Super Output Area of Leeds - a geographic measurement of around 7,200 people - from the start of the pandemic.
Tests were rolled out to every person with symptoms on May 18, but cases remained low across Leeds until the beginning of September, when infection rates began to climb. These are the 15 Leeds neighbourhoods which recorded the highest infection rates in the city during the second wave of the virus. All images are for illustrative purposes.
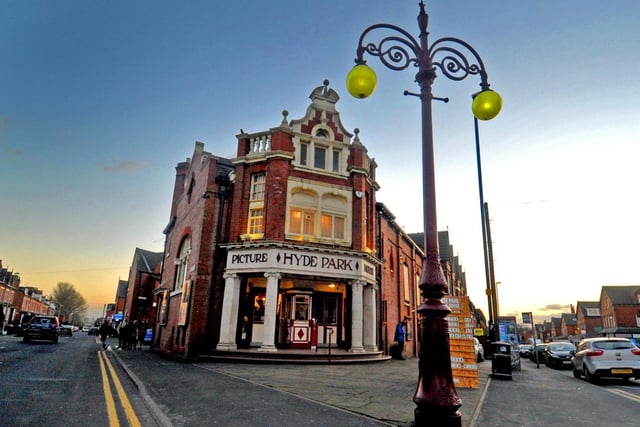
1. Hyde Park
Hyde Park recorded an infection rate of 4,287.2 new cases per 100,000 people in the seven days to October 7 - the highest rate ever recorded in the city
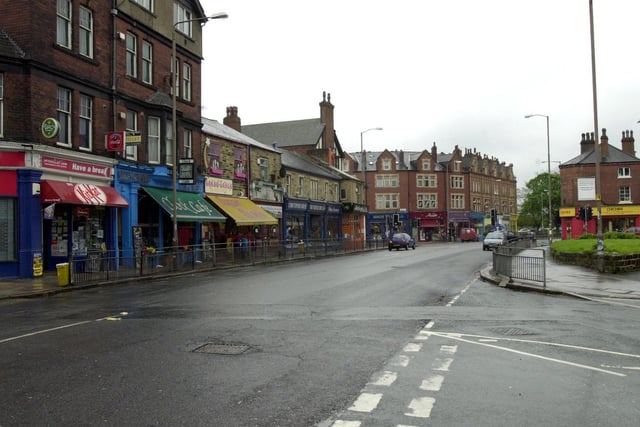
2. Hyde Park Corner and Woodhouse Cliff
Hyde Park Corner and Woodhouse Cliff recorded an infection rate of 3,951.6 new cases per 100,000 people on October 7
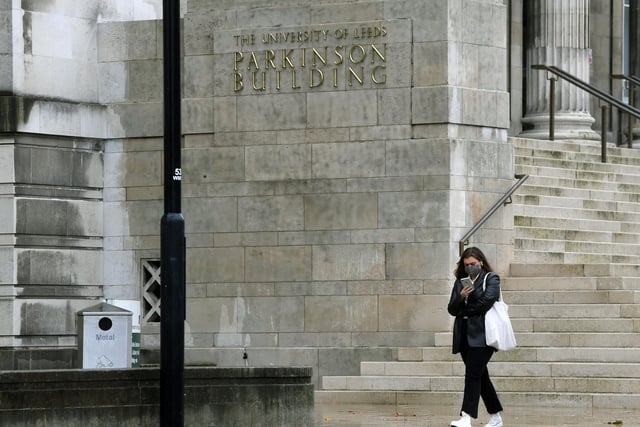
3. University and Little Woodhouse
University and Little Woodhouse recorded an infection rate of 3,653.6 new cases per 100,000 people in the seven days to October 7
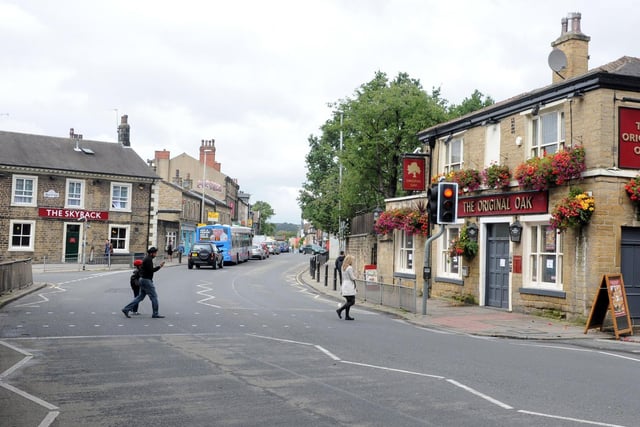
4. Headingley
Headingley recorded an infection rate of 2069.5 new cases per 100,000 people in the seven days to October 7
5. Leeds City Centre
Leeds City Centre recorded an infection rate of 1934.3 new cases per 100,000 people in the seven days to October 7
6. Woodhouse and Little London
Woodhouse and Little London recorded an infection rate of 1690.1 new cases per 100,000 people in the seven days to September 30