

The latest figures, for the seven days to May 16, are based on tests carried out in laboratories (pillar one of the Government’s testing programme) and in the wider community (pillar two). The rate is expressed as the number of new cases per 100,000 people. Data for the most recent days has been excluded as it is incomplete and does not reflect the true number of cases. Of the 315 local areas in England, 122 (39 per cent) have seen a rise in case rates, 182 (58 per cent) have recorded a fall and 11 are unchanged. Images are for illustrative purposes only.
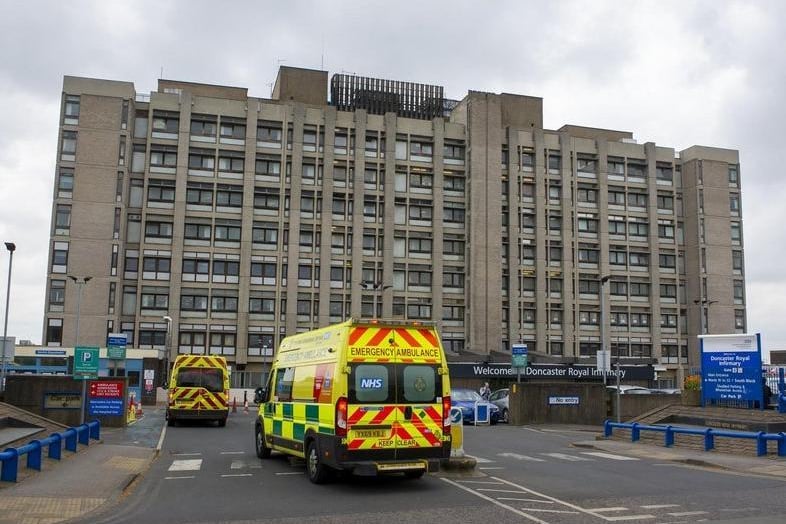
7. Doncaster
Doncaster had a rate of 33.0 (103 cases) in the seven days to May 16, down from 44.6 (139 cases) the previous week.
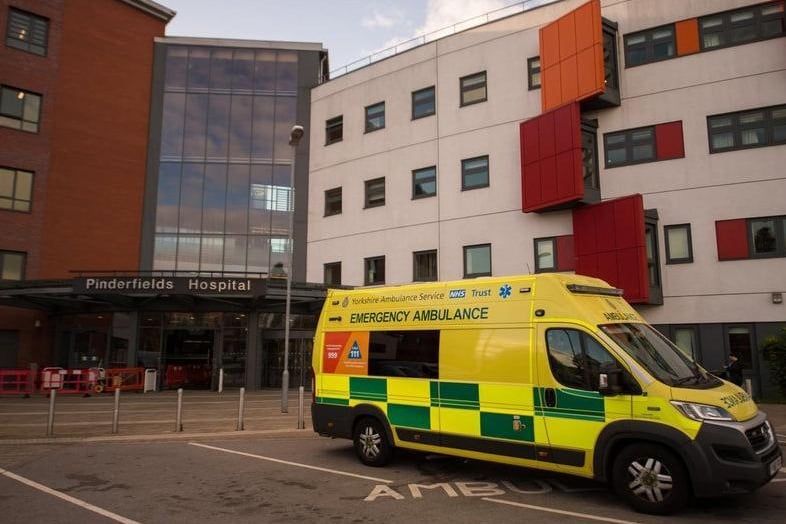
8. Wakefield
Wakefield had a rate of 28.4 (99 cases) in the seven days to May 16, down from 50.5 (176 cases) the previous week. (photo: SWNS)

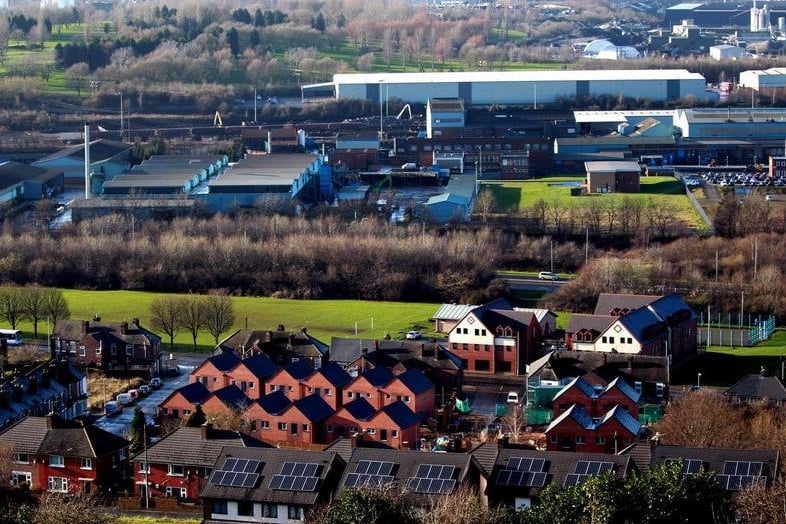
9. Barnsley
Barnsley had a rate of 27.5 (68 cases) in the seven days to May 16, down from 51.8 (128 cases) the previous week.
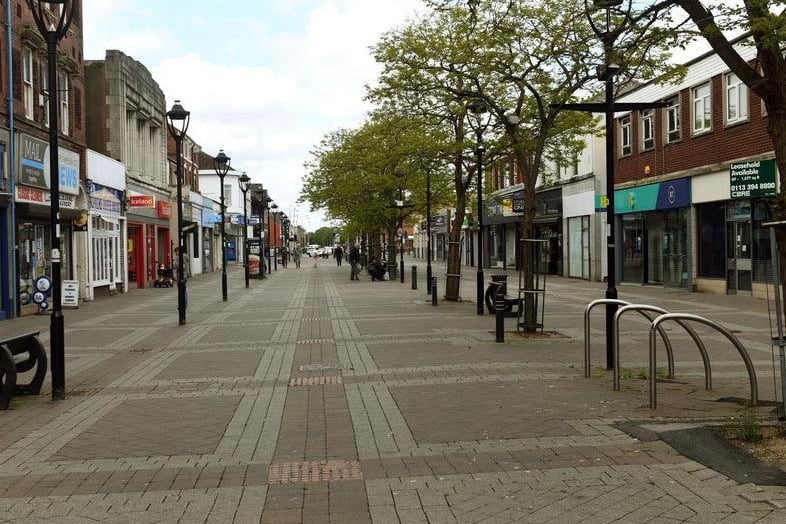
10. Rotherham
Rotherham had a rate of 26.8 (71 cases) in the seven days to May 16, down from 38.1 (101 cases) the previous week.
11. East Riding of Yorkshire
East Riding of Yorkshire had a rate of 23.2 (79 cases) in the seven days to May 16, up from 21.7 (74 cases) the previous week.
12. Calderdale
Calderdale had a rate of 38.8 (82 cases) in the seven days to May 16, the same as the previous week.