

Official Government figures show that since mid-January the rate of positive Covid cases per 100,000 people in Leeds has been falling. It's now down to 102.5 after almost 10 weeks of lockdown. But infection rates vary across the city's Middle Super Output Areas, a geographic measure of about 8,000 people. Here we reveal which Leeds areas had the highest infection rates in the seven days to March 9, the latest available figures. All images are for illustrative purposes only.
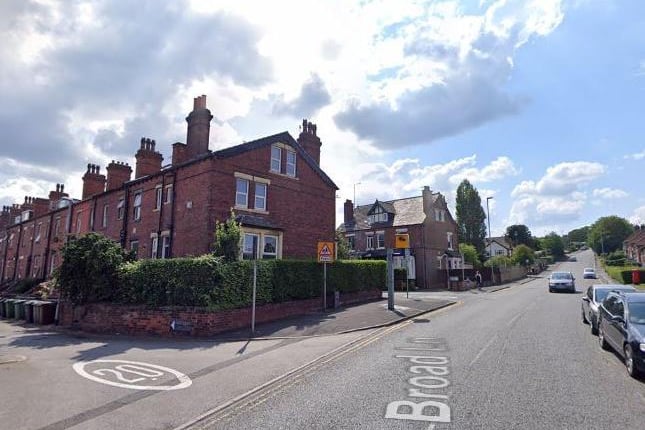
7. Bramley East
Bramley East recorded 16 cases in the seven days to March 9 - a rate of 210.1. The rate is up 77.8% from the previous week. Photo: Google
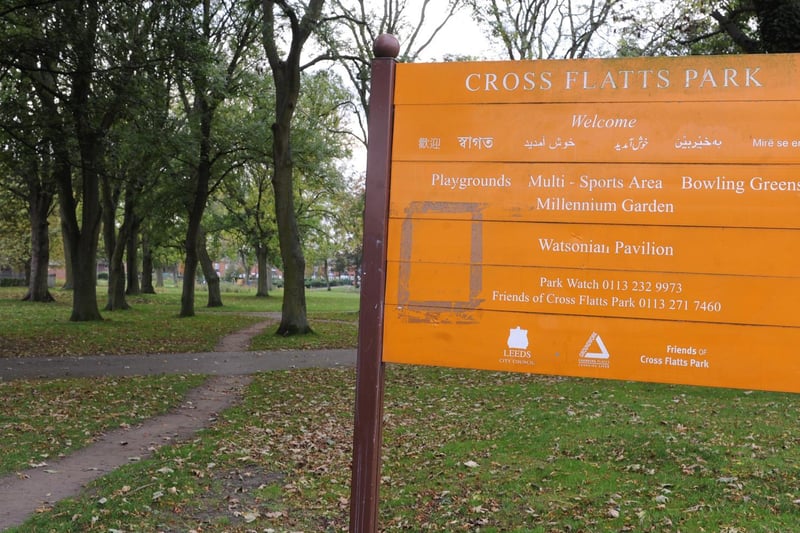
8. Cross Flatts Park & Garnets
Cross Flatts Park & Garnets recorded 15 cases in the seven days to March 9 - a rate of 198.5. The rate is down 34.8% from the previous week.
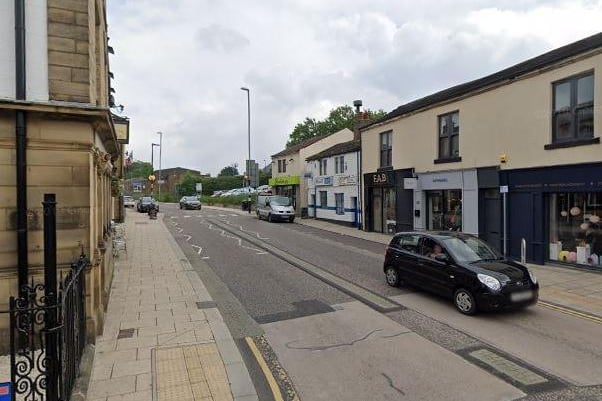
9. Pudsey South East
Pudsey South East recorded 14 cases in the seven days to March 9 - a rate of 194.1. The rate is up 133.3% from the previous week. Photo: Google
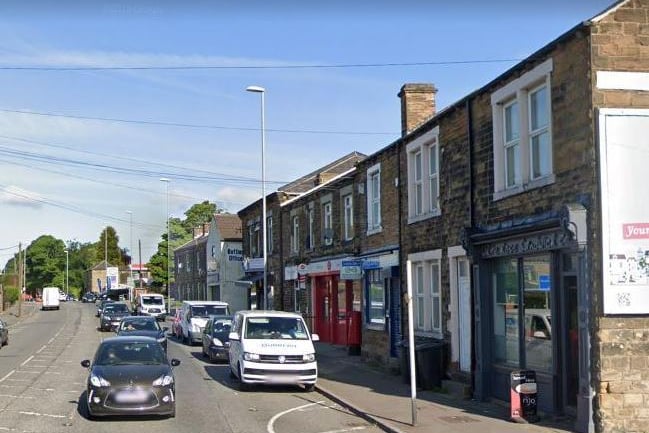
10. Tingley East & East Ardsley
Tingley East & East Ardsley recorded 12 cases in the seven days to March 9 - a rate of 181.9. The rate is up 33.3% from the previous week. Photo: Google
11. Garforth South, Swillington & Little Preston
Garforth South, Swillington & Little Preston recorded 12 cases in the seven days to March 9 - a rate of 176.9. The rate is up 140.0% from the previous week. Photo: Google
12. Morley North & Gildersome East
Morley North & Gildersome East recorded 13 cases in the seven days to March 9 - a rate of 172.8. The rate is up 18.2% from the previous week. Photo: Google