

The latest Government figures show there were 2,594 coronavirus cases recorded in Leeds in the seven days to January 3, an infection rate of 327.1 cases per 100,000 people. That's up 64.2 per cent from the previous seven day period. But infection rates vary across the city's Middle Super Output Areas (MSOA) - a geographic measure of approximately 7,200 people. These 12 Leeds neighborhoods were the only areas in the city to see infection rates fall in the seven days to January 3, the latest available figures. Images are for illustrative purposes only.
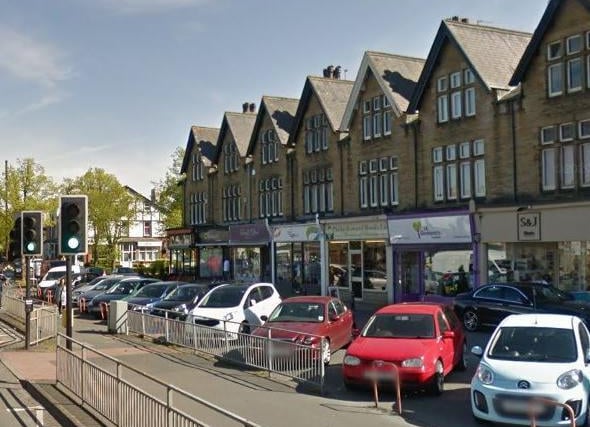
7. Roundhay West - down 21.4%
Roundhay West had 11 new cases in the seven days to January 3, that’s a rate of 185.2.. It’s down 21.4% from the previous week Photo: Google
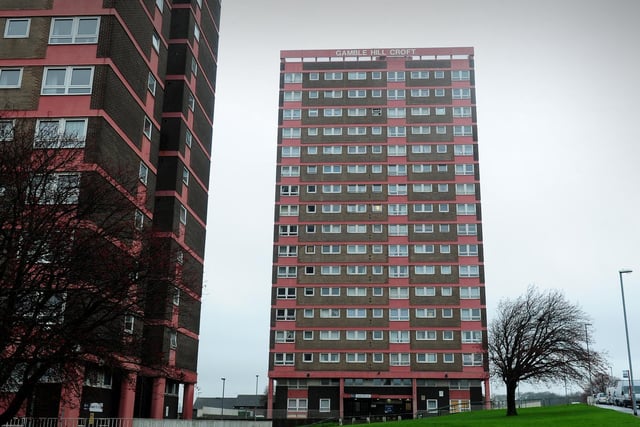
8. Bramley South & Upper Armley - down 21.1%
Bramley South & Upper Armley had 15 new cases in the seven days to January 3, that’s a rate of 170.9.. It’s down 21.1% from the previous week
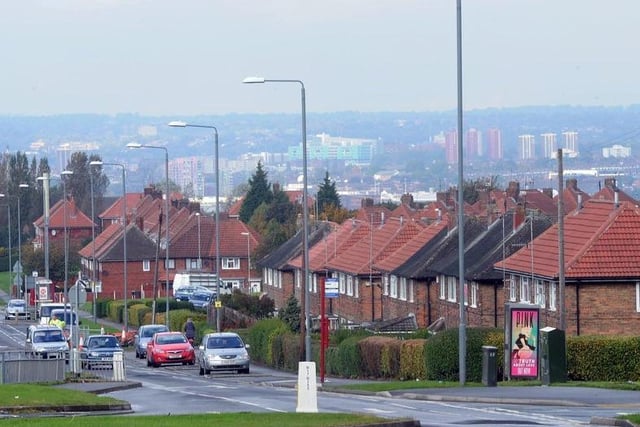
9. Belle Isle South - down 14.3%
Belle Isle South had 12 new cases in the seven days to January 3, that’s a rate of 209.8.. It’s down 14.3% from the previous week
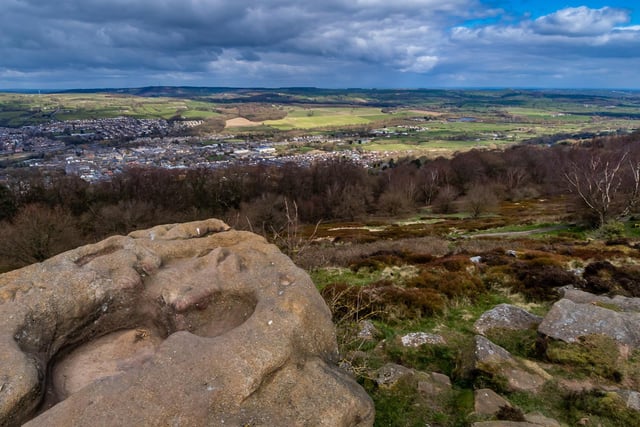
10. Otley South - down 9.1%
Otley South had 10 new cases in the seven days to January 3, that’s a rate of 130.9.. It’s down 9.1% from the previous week
11. Carr Manor - down 8.1%
Carr Manor had 34 new cases in the seven days to January 3, that’s a rate of 441.4. It’s down 8.1% from the previous week Photo: Google
12. Farsley South, Stanningley & Pudsey North West - down 7.1%
Farsley South, Stanningley & Pudsey North West had 13 new cases in the seven days to January 3, that’s a rate of 175.4.. It’s down 7.1% from the previous week