
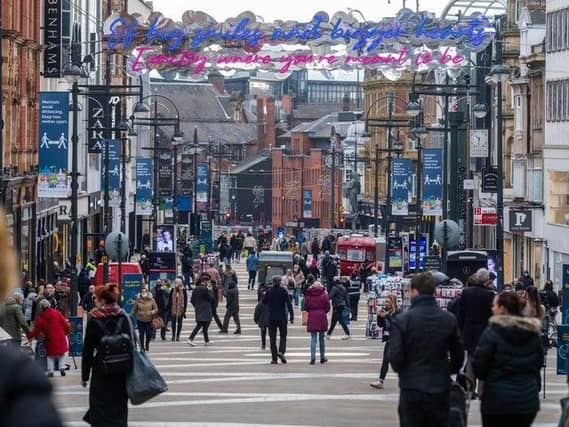

The latest figures show 42 out of 107 Middle Super Output Areas - a geographic measure of around 8,000 people - have seen a rise in infections in the latest seven-day period. Here we reveal which neighbourhoods have seen the biggest rise in case rates per 100,000 people between January 29 and February 5. All pictures are for illustrative purposes only.
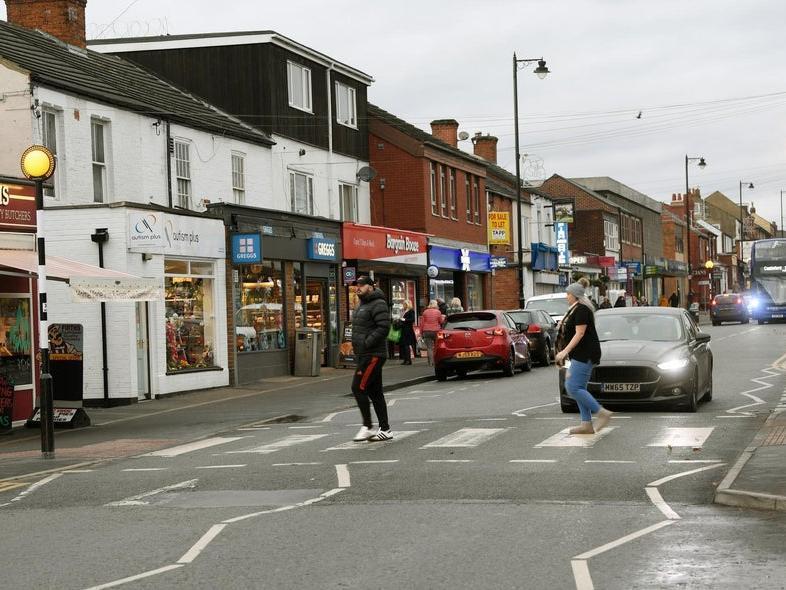
13. Garforth West
Garforth West has seen rates of positive Covid cases rise by 57.1%, from 117.0 to 183.8.
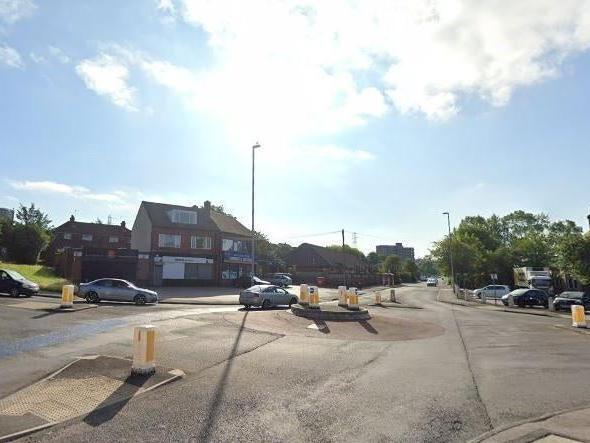
14. Farnley East
Farnley East has seen rates of positive Covid cases rise by 56.3%, from 246.6 to 385.4.
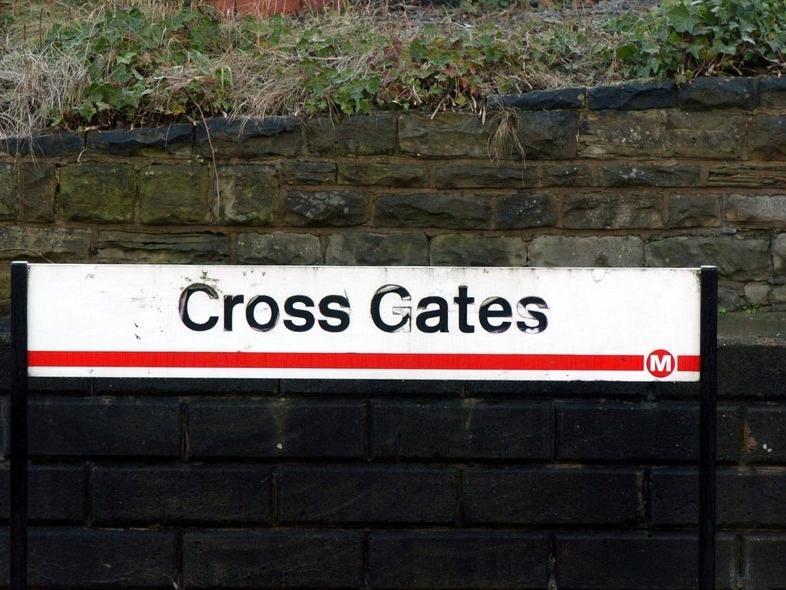
15. Cross Gates West and Killingbeck
Cross Gates West and Killingbeck has seen rates of positive Covid cases rise by 50%, from 157.6 to 236.4.
3 / 3