

The overall Covid infection rate for Leeds was recorded as 231 cases per 100,000 people on February 2. Here we reveal the Leeds neighbourhoods where the case rates have risen the fastest between January 21 and January 28, the latest dates for which figures are available. The figures show that 35 out of the 107 Middle Supper Output Areas in Leeds - a geographic measure of approximately 8,000 people - have seen a rise in cases. Images are for illustrative purposes only.
7. Yeadon East
Yeadon East has seen rates of positive Covid cases rise by 50 per cent, from 144.0 cases per 100,000 people (January 21) to 216.1 cases per 100,000 people (January 28).
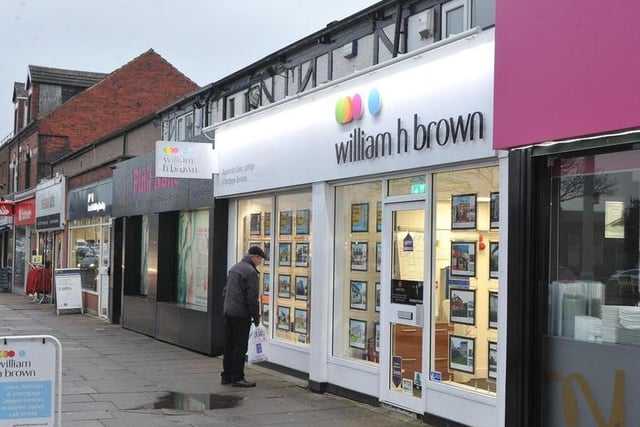
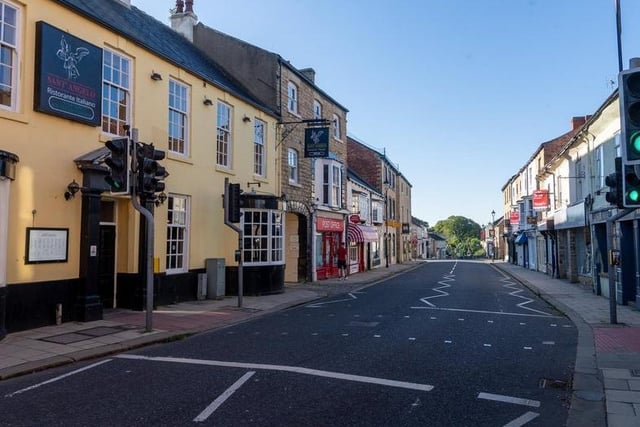
8. Morley Central
Morley Central has seen rates of positive Covid cases rise by 50 per cent, from 248.6 cases per 100,000 people (January 21) to 373.0 cases per 100,000 people (January 28). (photo: Google)
9. Cross Gates East and Manston
Cross Gates East and Manston has seen rates of positive Covid cases rise by 50 per cent, from 187.4 cases per 100,000 people (January 21) to 281.1 cases per 100,000 people (January 28).
10. Whinmoor
Whinmoor has seen rates of positive Covid cases rise by 48 per cent, from 294.8 cases per 100,000 people (January 21) to 435.8 cases per 100,000 people (January 28).
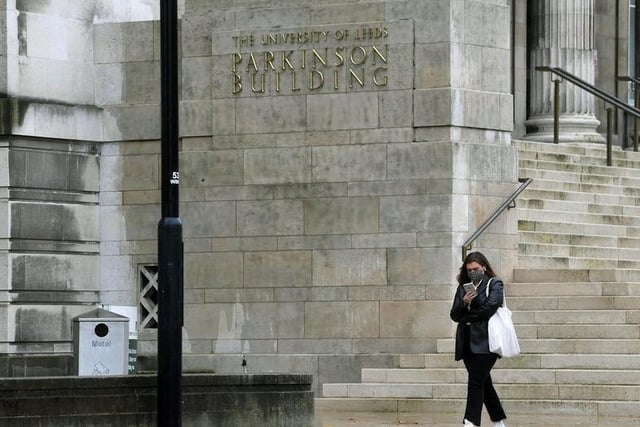
11.
University and Little Woodhouse has seen rates of positive Covid cases rise by 45 per cent, from 95.9 cases per 100,000 people (January 21) to 139.5 cases per 100,000 people (January 28).
12. Wetherby West
Wetherby West has seen rates of positive Covid cases rise by 44 per cent, from 136.9 cases per 100,000 people (January 21) to 197.8 cases per 100,000 people (January 28).