
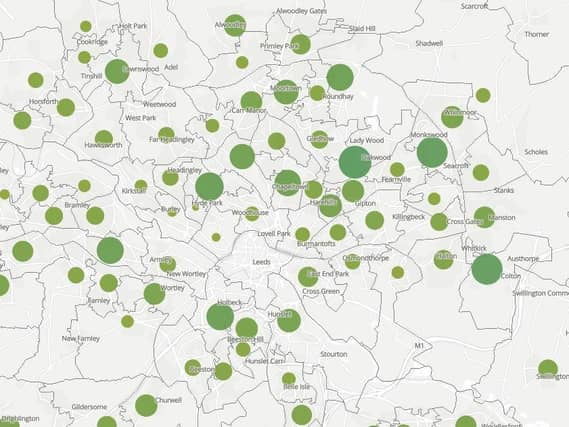

Figures are available on the new live map, which can be viewed by clicking here. The figures included are from March 2020 to February 2021. Points on the map are placed at the centre of the local area they represent and do not show the actual location of deaths. Figures are for deaths registered rather than deaths occurring in each month. Deaths "due to COVID-19" include only deaths where COVID-19 was the underlying cause of death.
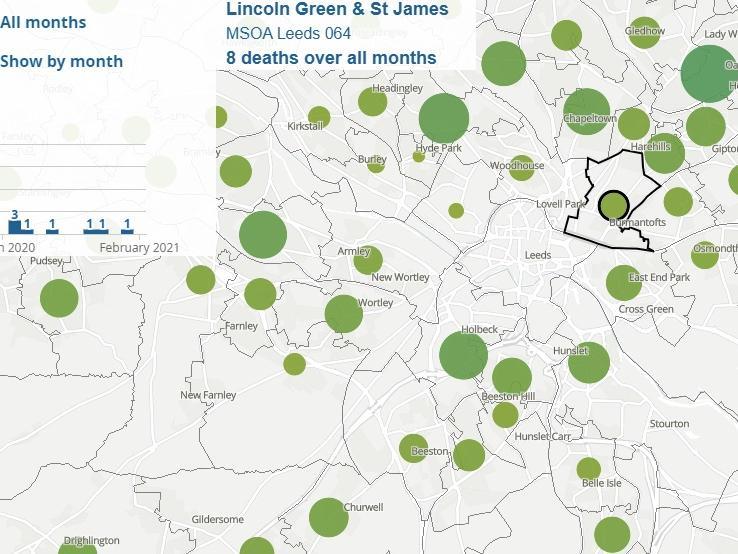
9. Lincoln Green and St James
Eight deaths have been recorded in Lincoln Green and St James. Photo: ONS
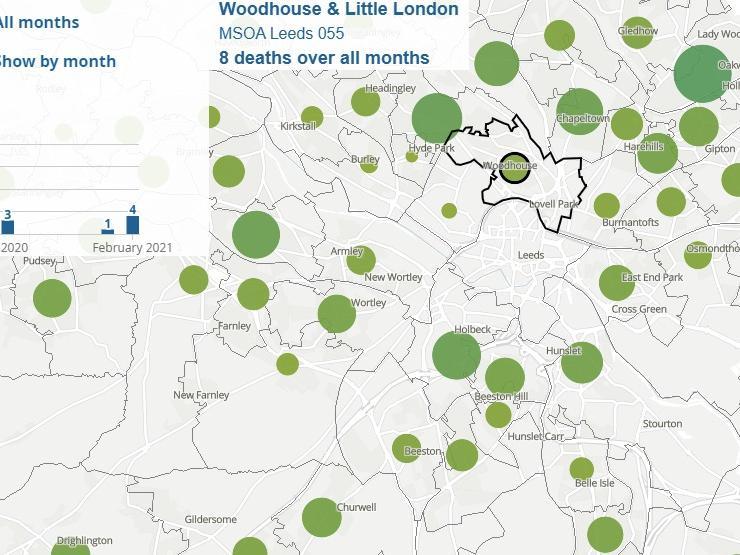
10. Woodhouse and Little London
Eight deaths have been recorded in Woodhouse and Little London. Photo: ONS
2 / 2