

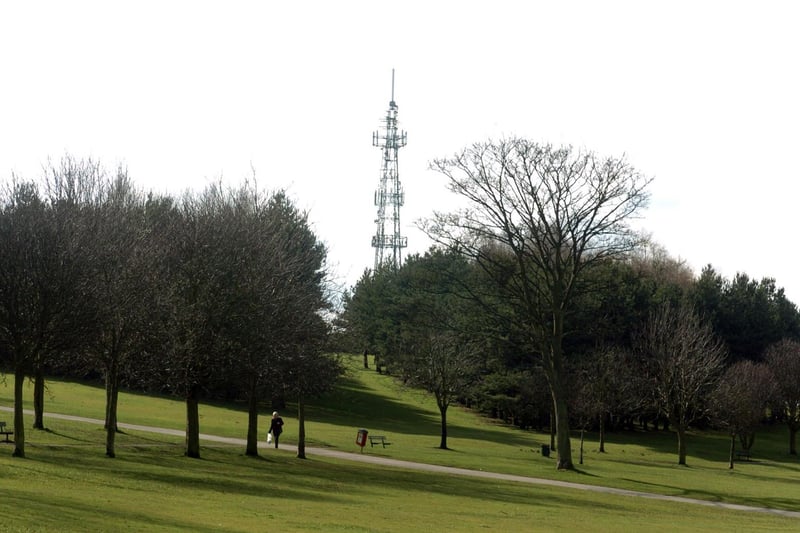
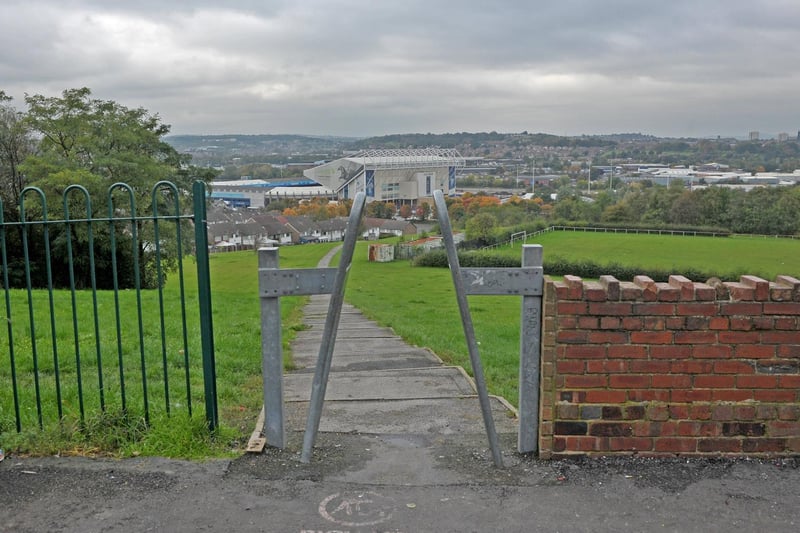
Official Government figures show that since mid-January the rate of positive Covid cases per 100,000 people in Leeds has been falling. It's now down to 170.8 after more than six weeks in lockdown. But infection rates vary across the city's Middle Super Output Areas, a geographic measure of about 8,000 people. Here we reveal which Leeds areas had the highest infection rates in the seven days to February 11, the latest available figures. All images are for illustrative purposes only.
7. Bramley Park North
Bramley Park North recorded 16 cases, that’s a rate of 310. It’s up 60% from the previous week.
8. Beeston Hill & Hunslet Moor
Beeston Hill & Hunslet Moor recorded 21 cases, that’s a rate of 308.1. It’s down 27.6% from the previous week.
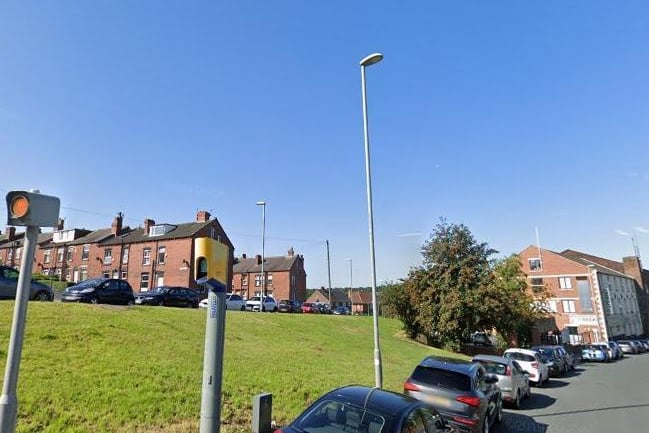
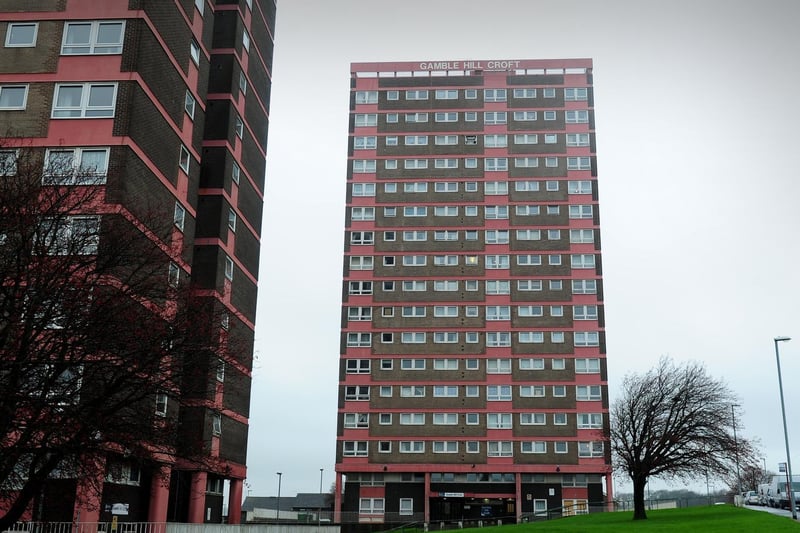
9. Farnley West & Gamble Hill
Farnley West & Gamble Hill recorded 17 cases, that’s a rate of 288.9. It’s the same rate as the previous week. Photo: Google
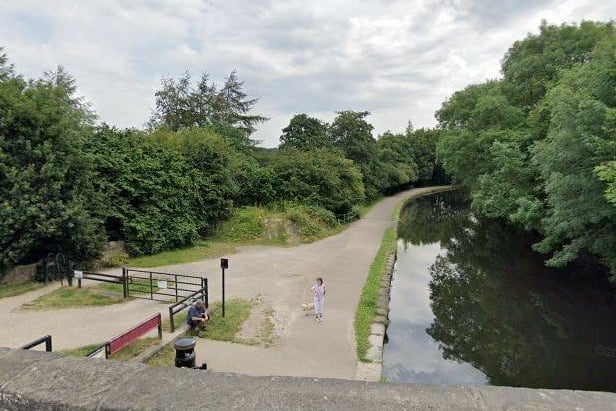
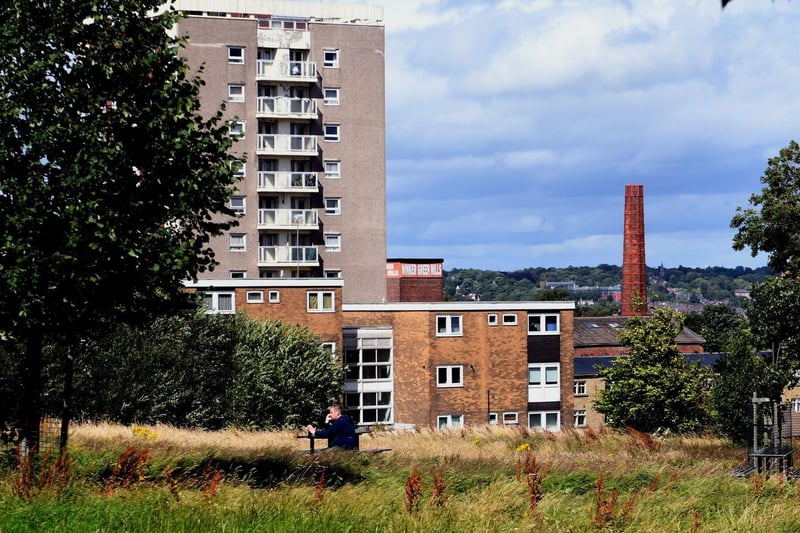
10. Bramley Fall
Bramley Fall recorded 18 cases, that’s a rate of 287. It’s up 50% from the previous week. Photo: Google
11. Bramley South & Upper Armley
Bramley South & Upper Armley recorded 25 cases, that’s a rate of 284.9. It’s down 7.4% from the previous week.
12. Armley & New Wortley
Armley & New Wortley recorded 25 cases, that’s a rate of 283.8. It’s down 16.7% from the previous week.