
The infection rate has fallen steadily in Leeds over the last few weeks, dropping by 31.9 per cent in the seven days to April 14 compared to the previous week. It now stands at 48.4 new cases per 100,000 people.
But infection rates vary across the city's Middle Super Output Areas, a geographic measure of about 8,000 people. Here we reveal which Leeds areas had the highest infection rates in the seven days to April 14, the latest available figures.
All images are for illustrative purposes only.
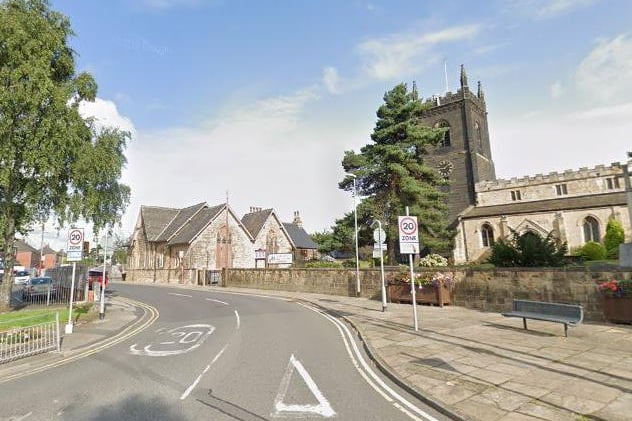
1. Garforth South, Swillington & Little Preston
Garforth South, Swillington & Little Preston recorded 14 new cases, that’s a rate of 206.4 new cases per 100,000 people. It’s up 16.7% from the previous week. Photo: Google
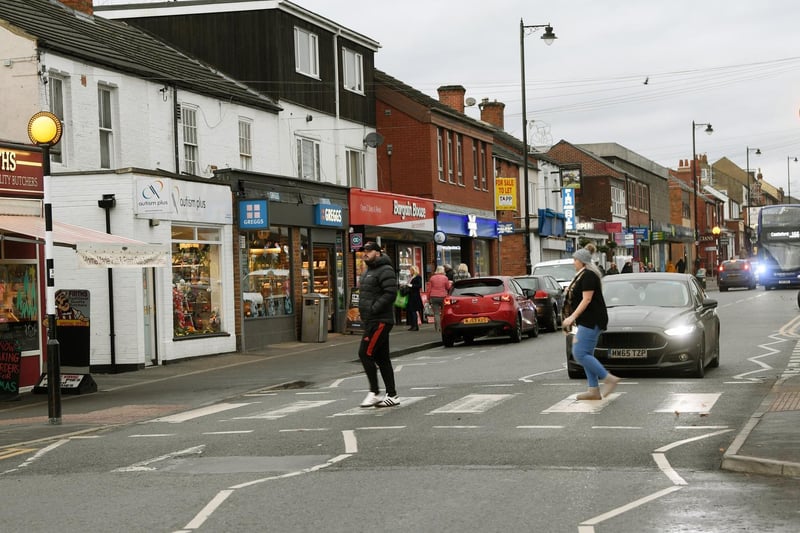
2. Garforth West
Garforth West recorded 8 new cases, that’s a rate of 133.7 new cases per 100,000 people. It’s down 27.3% from the previous week.
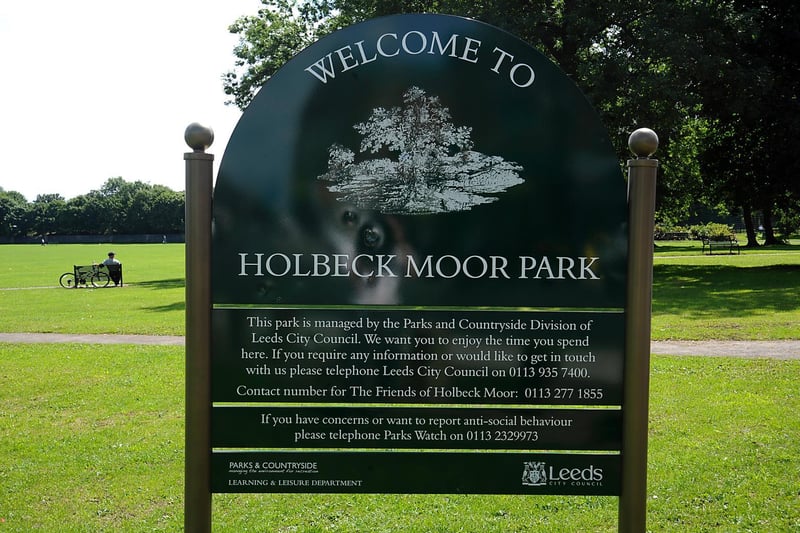
3. Holbeck
Holbeck recorded 11 new cases, that’s a rate of 124.8 new cases per 100,000 people. It’s down 31.2% from the previous week.
4. New Pudsey
New Pudsey recorded 8 new cases, that’s a rate of 116.9 new cases per 100,000 people. It’s down 27.3% from the previous week.
5. Aberford, Barwick & Thorner
Aberford, Barwick & Thorner recorded 7 new cases, that’s a rate of 108.5 new cases per 100,000 people. It’s up 133.3% from the previous week. Photo: Paul Goodyear

6. Rothwell Inner
Rothwell Inner recorded 7 new cases, that’s a rate of 104.2 new cases per 100,000 people. It’s up 133.3% from the previous week.