

For the seven days to June 17, the latest date for which figures are available, Hyde Park's rate was 1,381.8 cases per 100,000 people.
For the same time period, the overall rate in Leeds was 210.6 per 100,000 people.
This is an increase of 51.7 per cent in the seven-day case rate.
As cases continue to rise, we reveal which Leeds neighbourhoods had the highest rates in the seven days to June 17.
All images are for illustrative purposes only.
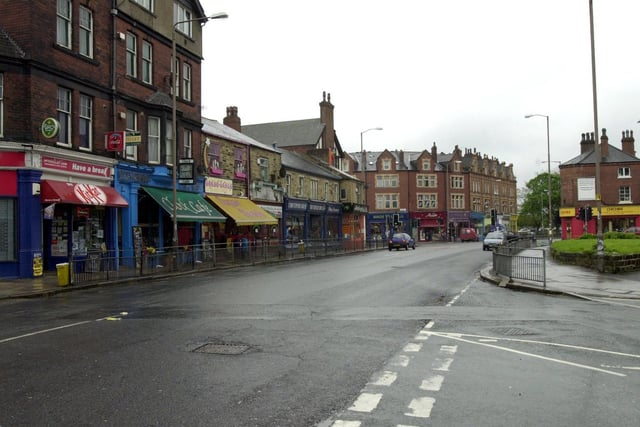
1. Hyde Park Corner & Woodhouse Cliff
Hyde Park Corner and Woodhouse Cliff had 182 new cases in the seven days to October 13 - that's a rate of 1,310.0 new cases per 100,000 people
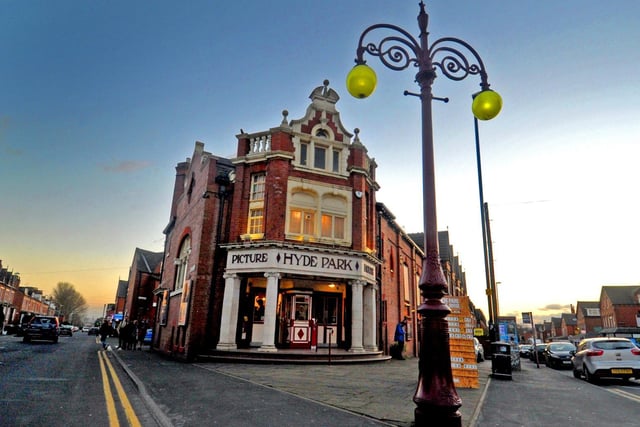
2. Hyde Park
Hyde Park had 102 new cases in the seven days to October 13 - that's a rate of 1,204.7 new cases per 100,000 people
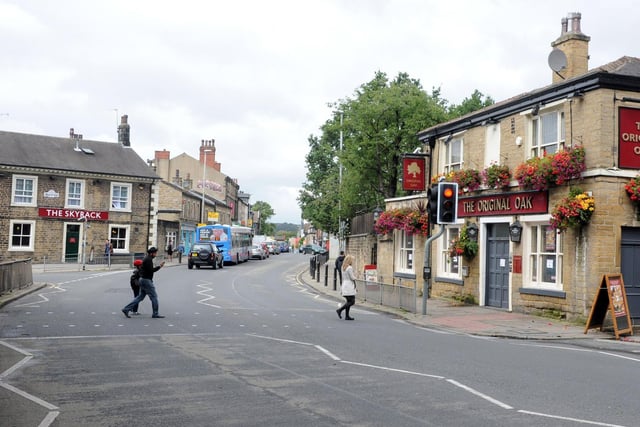
3. Headingley
Headingley had 83 new cases in the seven days to October 13 - that's a rate of 871.9 new cases per 100,000 people
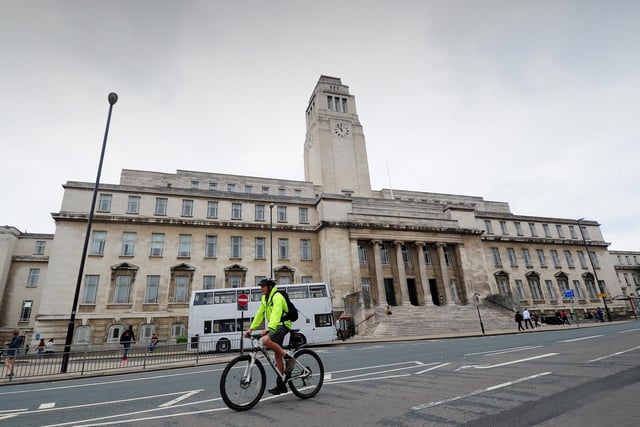
4. University & Little Woodhouse
University and Little Woodhouse had 94 new cases in the seven days to October 13 - that's a rate of 819.7 new cases per 100,000 people
5. Woodhouse & Little London
Woodhouse and Little London had 92 new cases in the seven days to October 13 - that's a rate of 694.1 new cases per 100,000 people
6. Leeds City Centre
Leeds City Centre had 92 new cases in the seven days to October 13 - that's a rate of 676.6 new cases per 100,000 people